Auto-detect granularity of time series data
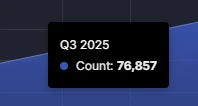
When you're charting unaggregated time series data, charts now auto-detect the time interval between data points. This lets you see something like Q3 2025 instead of 2023-10-01T00:00:00.
When you're charting unaggregated time series data, charts now auto-detect the time interval between data points. This lets you see something like Q3 2025 instead of 2023-10-01T00:00:00.
Ready to get started?