Supersimple's Model Context Protocol (MCP) server now lets you use Supersimple's AI with your entire company's context, right from inside Claude, Cursor, or any other MCP-capable assistant.
Once it's connected, your favorite AI assistant gains an Ask Supersimple tool to use whenever it needs to access any of the data you've connected to Supersimple. Answers respect your access, just like when asking from inside Supersimple's app.
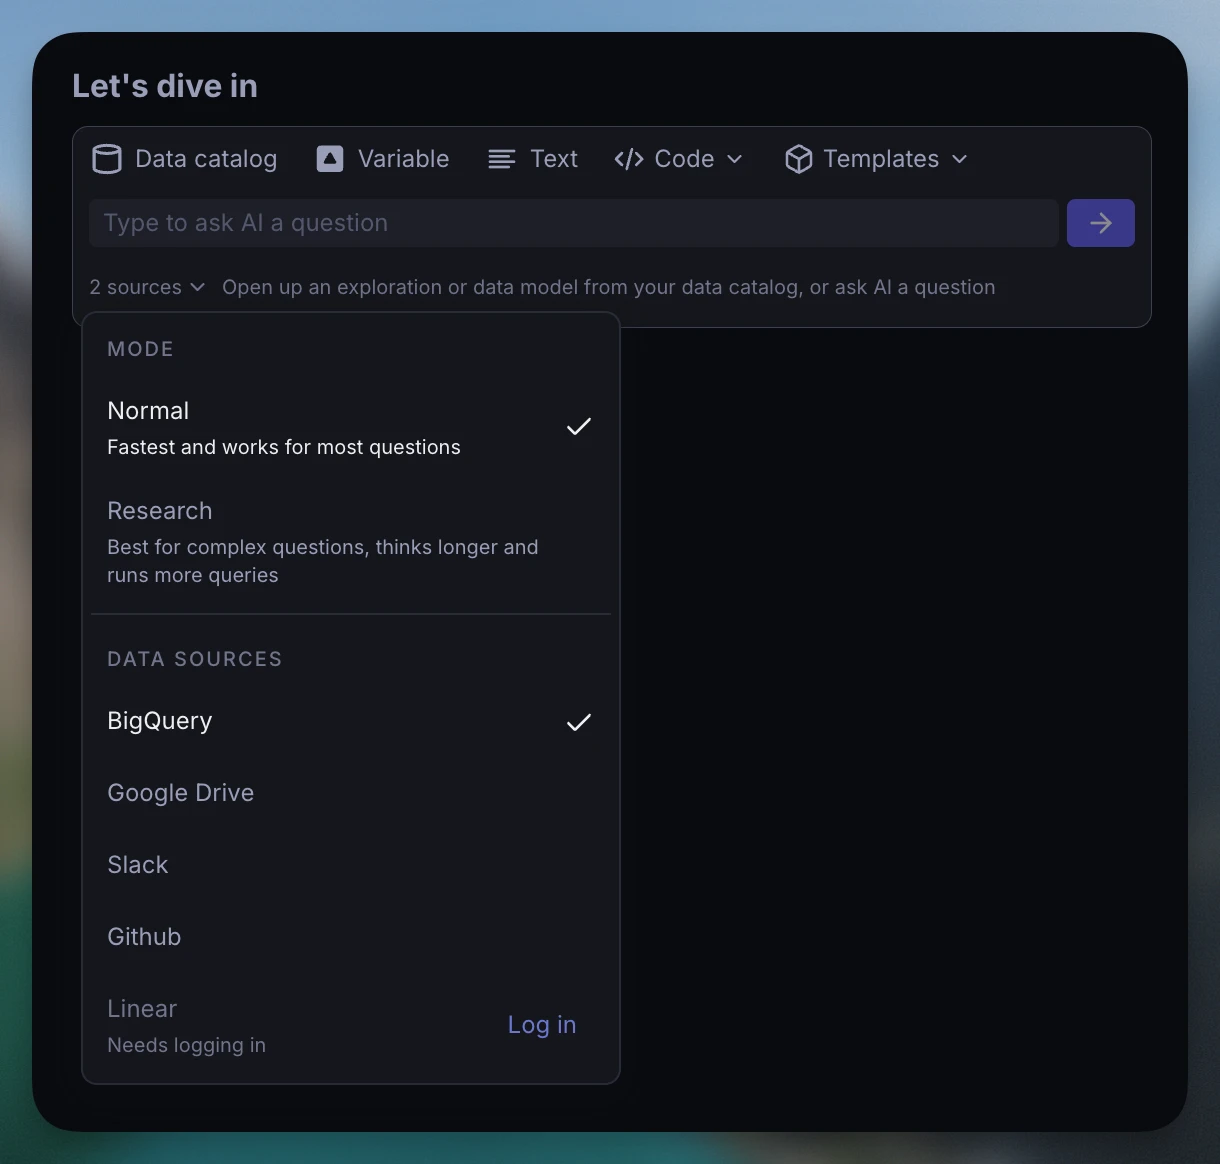
You can now connect any custom MCP (Model Context Protocol) server to Supersimple. Users can select it under the AI sources selector, alongside Supersimple's native integrations.
To enable proper access control, each user can separately log in to every given MCP server – authenticating it to act on their behalf.
A Supersimple account can now read from more than one database. Point each data model at the connection it should query with the connection field.
models:
  account:
    name: Account
    table: myschema.account
    # Name of the connection, exactly as it appears in Supersimple settings
    connection: Production Postgres Replica
    primary_key:
      - account_id
Relations (joins) only work between models on the same connection, and queries that try to combine connections are rejected with an explanation of why. To add another connection to your account, please contact support or your account manager.
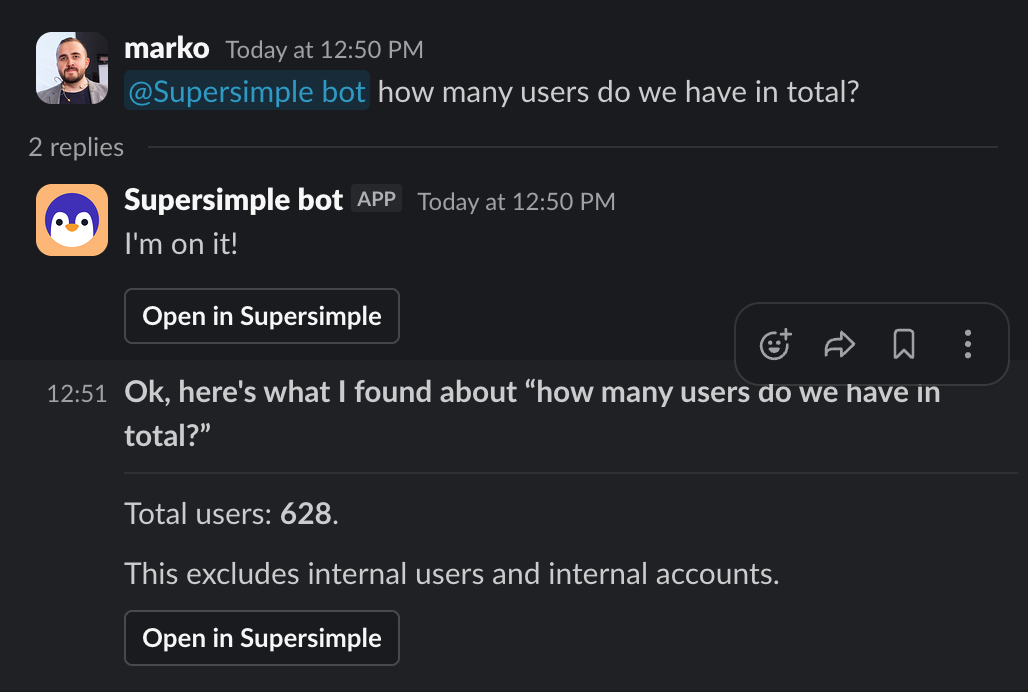
Tag @Supersimple in any channel it's in, and it answers right there in the thread.
@Supersimple which customers churned last month and why?
It reacts with 👀, works through the question, and replies in the thread with an Open in Supersimple button for the full exploration. Ask in a public channel and everyone there sees the answer. DM the bot to keep a question private.
Answers respect your access. The bot recognizes who's asking and uses exactly the permissions you'd have inside Supersimple, across every connected source. Two people asking the same thing may get different results.
Connect Supersimple to ClickHouse, MotherDuck, StarRocks, and Apache Spark. Each supports full schema discovery, so your models, explorations, and SQL blocks work exactly as they do with any other source.
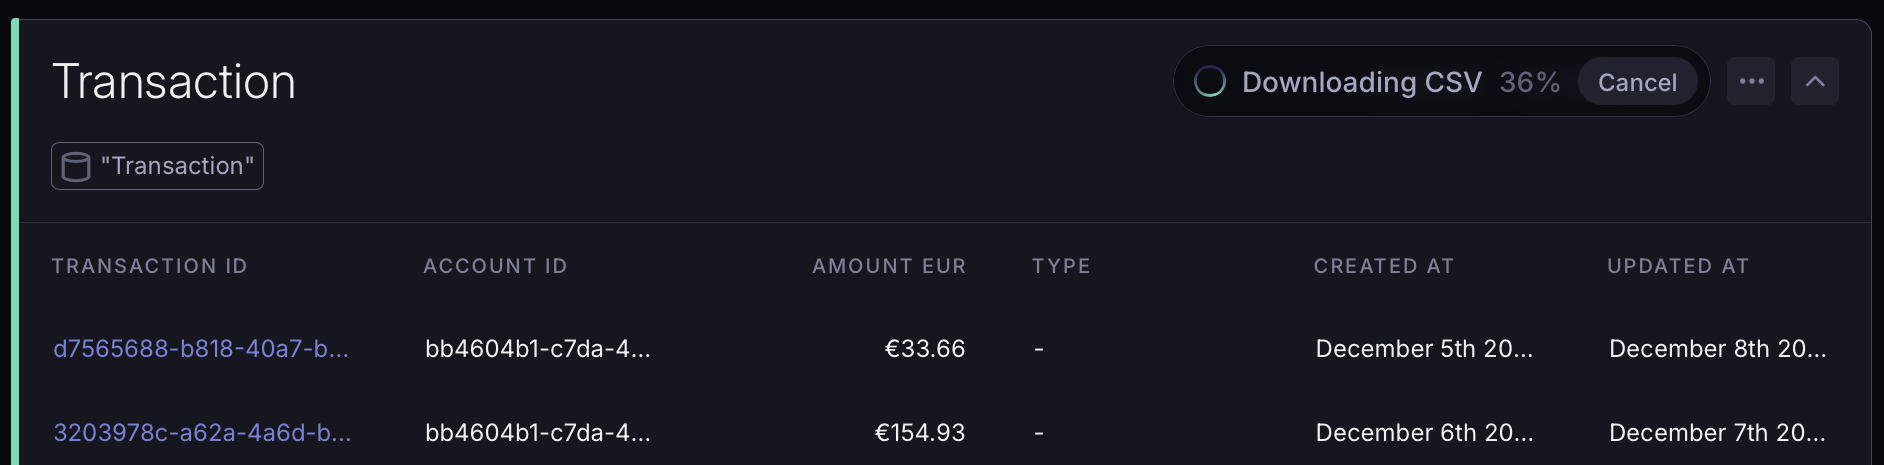
Export as much data as you need. The row cap is gone.
While a large export streams, a live progress chip shows you exactly where things stand: a percentage when the row total is known, or a running row count and elapsed time otherwise.
Changed your mind? Cancel mid-stream with a single click.
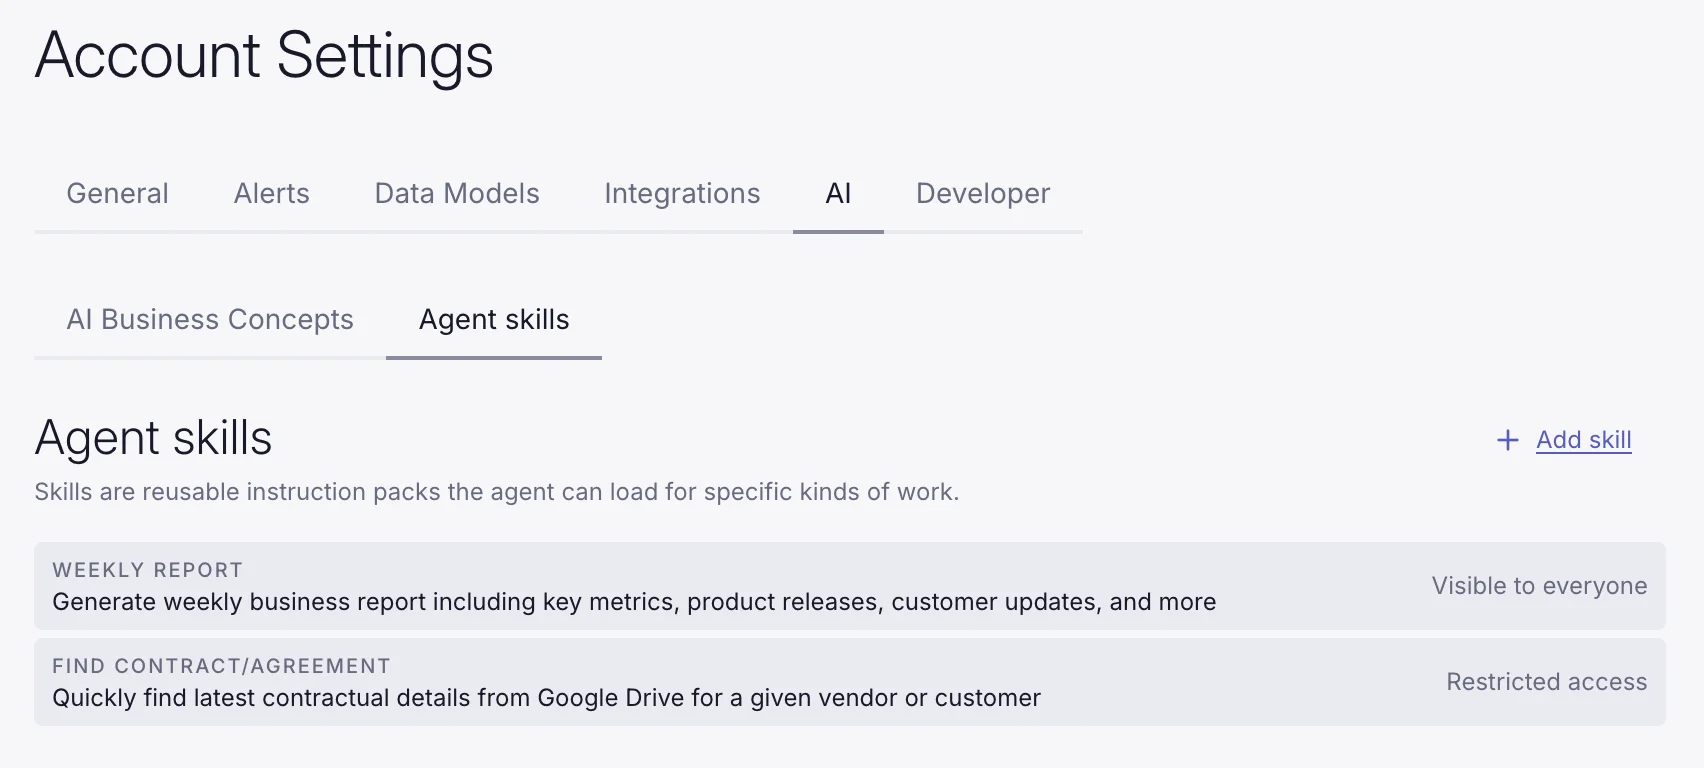
Skills are reusable instruction packs Supersimple's AI agent can load for specific kinds of work. When relevant to the current question, the AI pulls in the skill's full instructions on-demand.
This keeps your base system instructions focused and clear while still giving the agent deep, task-specific guidance where needed. Use skills to capture how your team writes a weekly report, finds the latest contract for a vendor, or any other recurring or complex workflow.
Skills can also be permissioned based on user attributes. Keep in mind that data access permissions still always apply, so the agent will only be able to pull in information from sources and data models the user has access to.
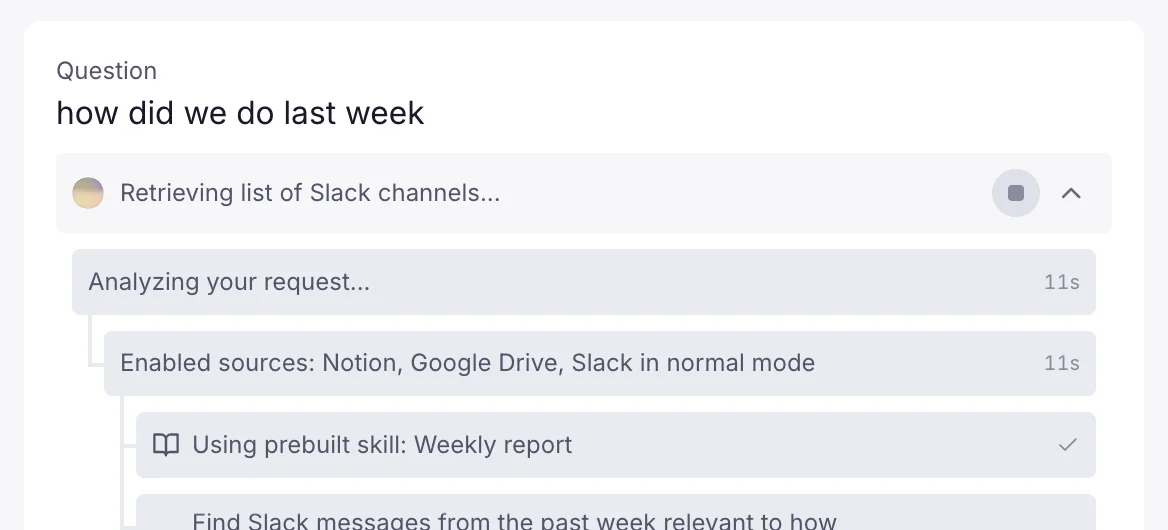
AI now collapses steps like intermediary outputs, debug queries, and more. This means you still see everything it did, while keeping the clean, final output front and center.
Accepting the AI's response drops these intermediary steps by default.
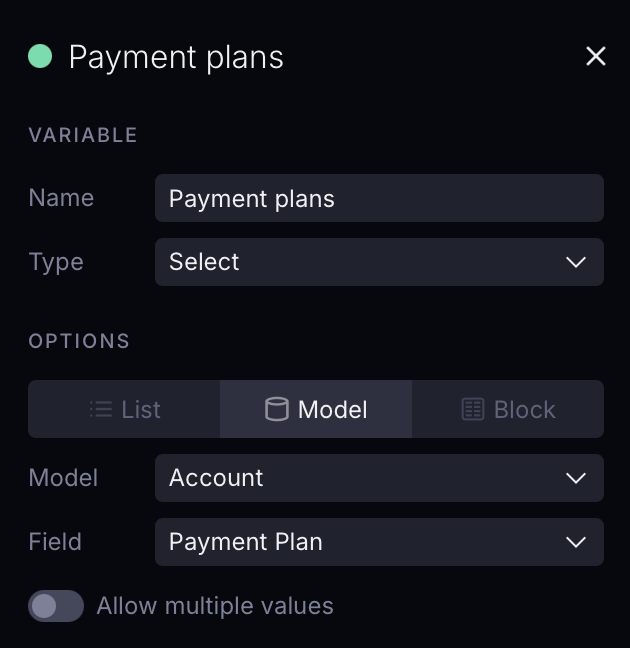
Date Range variables let you use a single Variable for both the start and end date of a filter. Pick a Dynamic range like "this month", or use Specific dates for things like "January 4th" or "all of February 2026".
You can also type the date range you're looking for in plain English, and see a real-time preview of how we interpreted your input.
Applying the Date Range variables to queries is as easy as filtering for some field "is" and then picking your Date Range variable from the dropdown.
User groups allow setting parameters for multiple users at once. Define groups with specific parameters and assign users to them. This way, you can manage permissions for teams or departments without configuring each user individually. User groups can be configured by account admins under settings.
Model-level permissions
Model-level permissions control who can see and query a data model. Hide entire models from users based on their parameters like properties given via user groups or their email.
Define an access block on the model and combine conditions with AND/OR logic to match departments, regions, specific emails, or anything else on the user.
You can now also use custom user parameters in addition to the user's email to filter rows within a model.
Row-level permissions filter which rows a user can access within a model, using {{user_parameters.<key>}} placeholders injected into SQL at query time. Reference the placeholder in the model's sql and each user sees only the rows matching their own parameters.
models:
  orders:
    name: Orders

    sql: |-
      SELECT * FROM orders
      WHERE region IN ({{user_parameters.region}})

    properties:
      order_id:
        name: Order ID
        type: String
      region:
        name: Region
        type: String
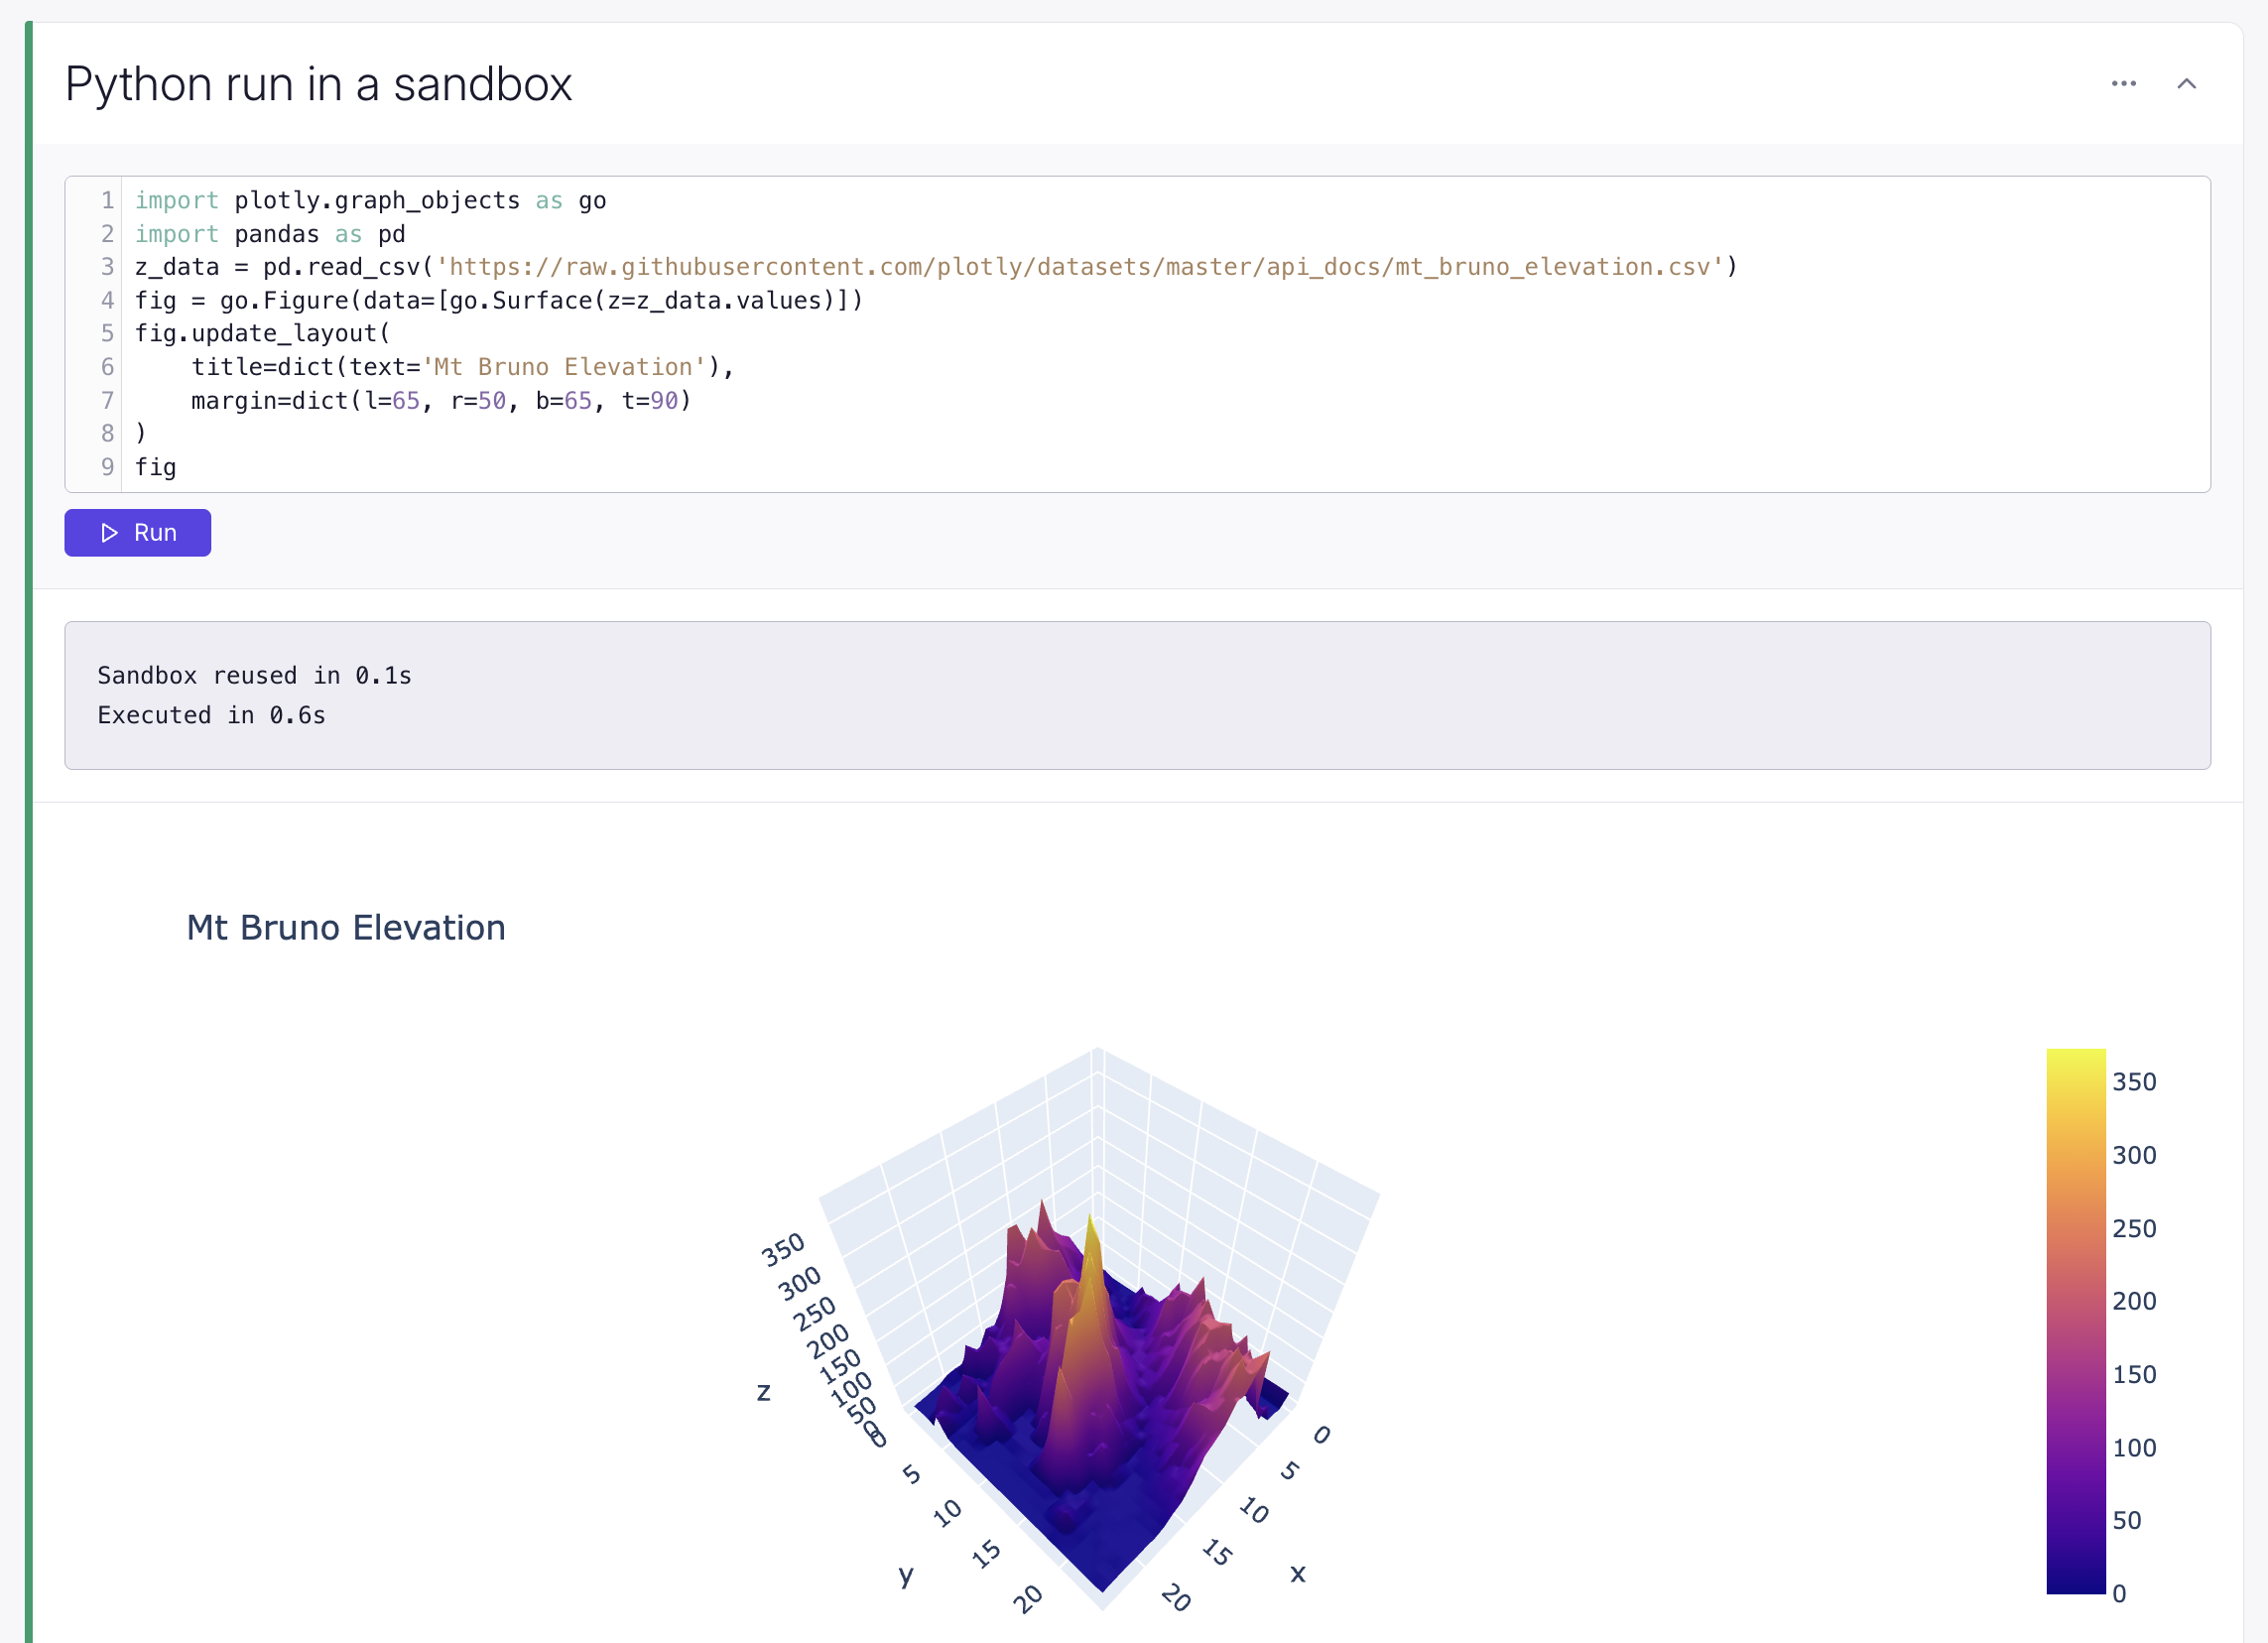
Python blocks now run in configurable sandboxes, instead of using Pyodide in your browser. This means support for any Python package and removes the memory limits of your browser tab.
Sandboxes are isolated between customers, and the default Docker image and machine resources (CPU, memory, and disk) are all configurable.
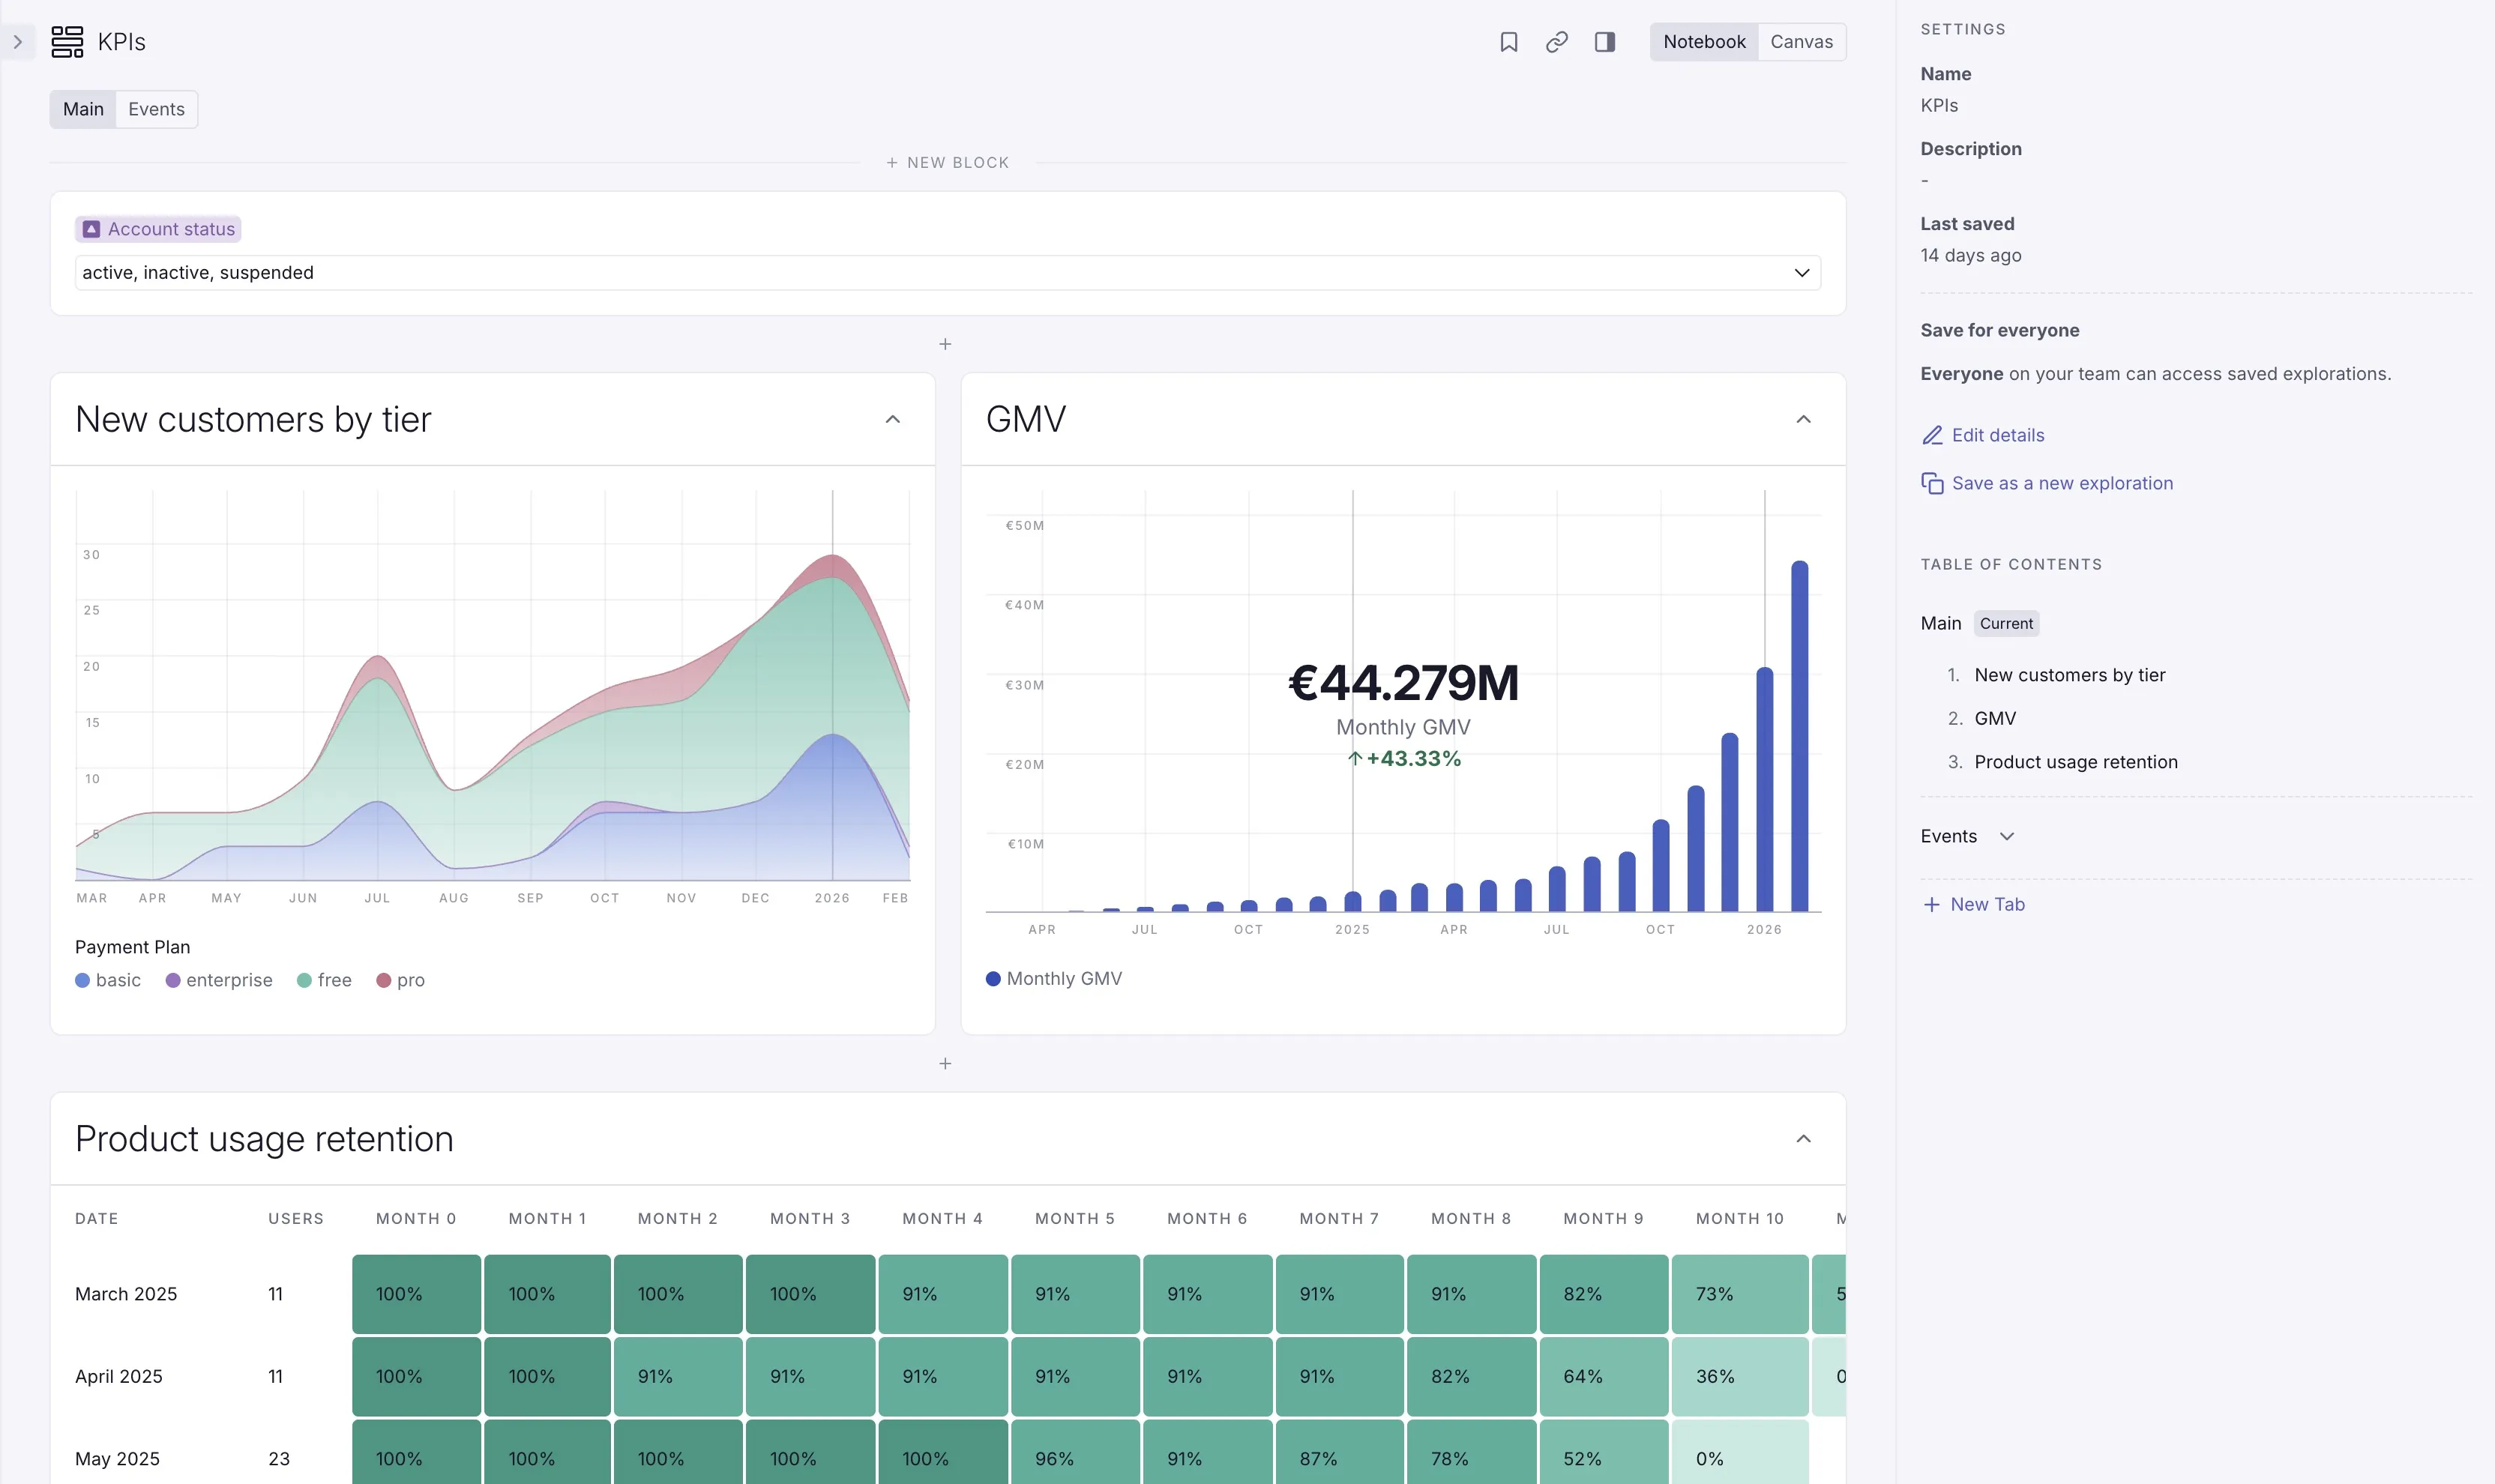
To use Python blocks inside dashboards, alongside other native blocks, you can now set them to auto-run on exploration load, and hide the code so only the output is shown – both from the right-hand sidebar.
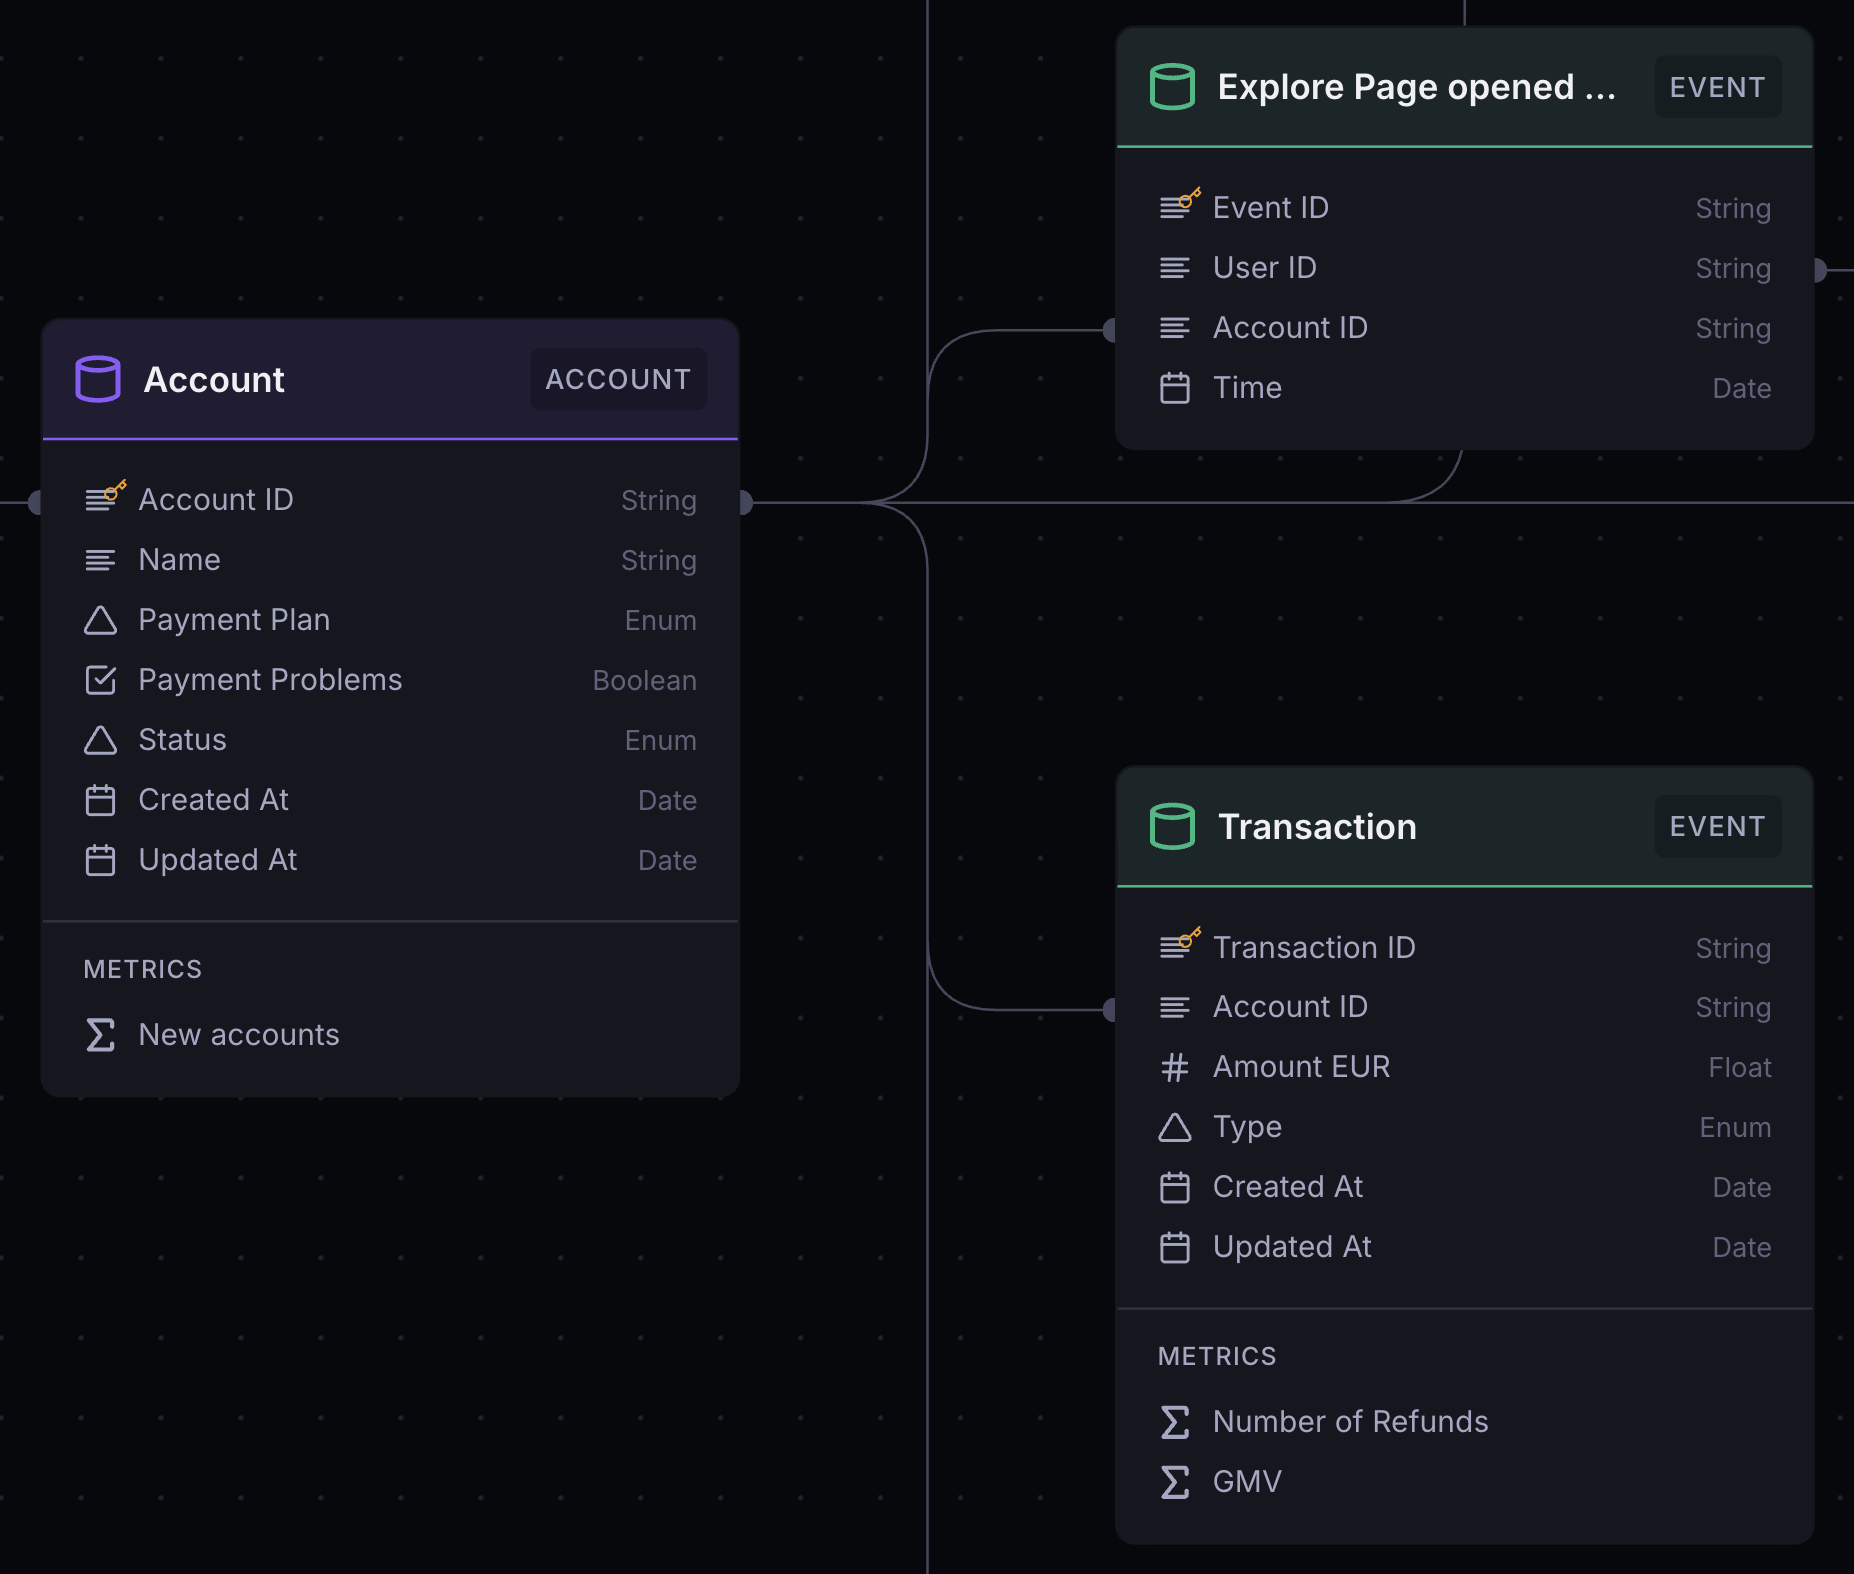
You can now define individual columns on a table-based model using a SQL expression, right where you define other column metadata.
properties:
  name:
    name: Name
    type: String
    sql: "case when {is_internal} then concat('(INTERNAL) ', {name}) else name end"
  name_upper:
    name: Name (uppercase)
    type: String
    sql: "upper({name})"
    description: "The name column, but in uppercase"
Use {column_name} to reference another column, whether from the source table or computed under properties using sql.
You can also use these sql-defined properties in any operations on the same data model, including filters.
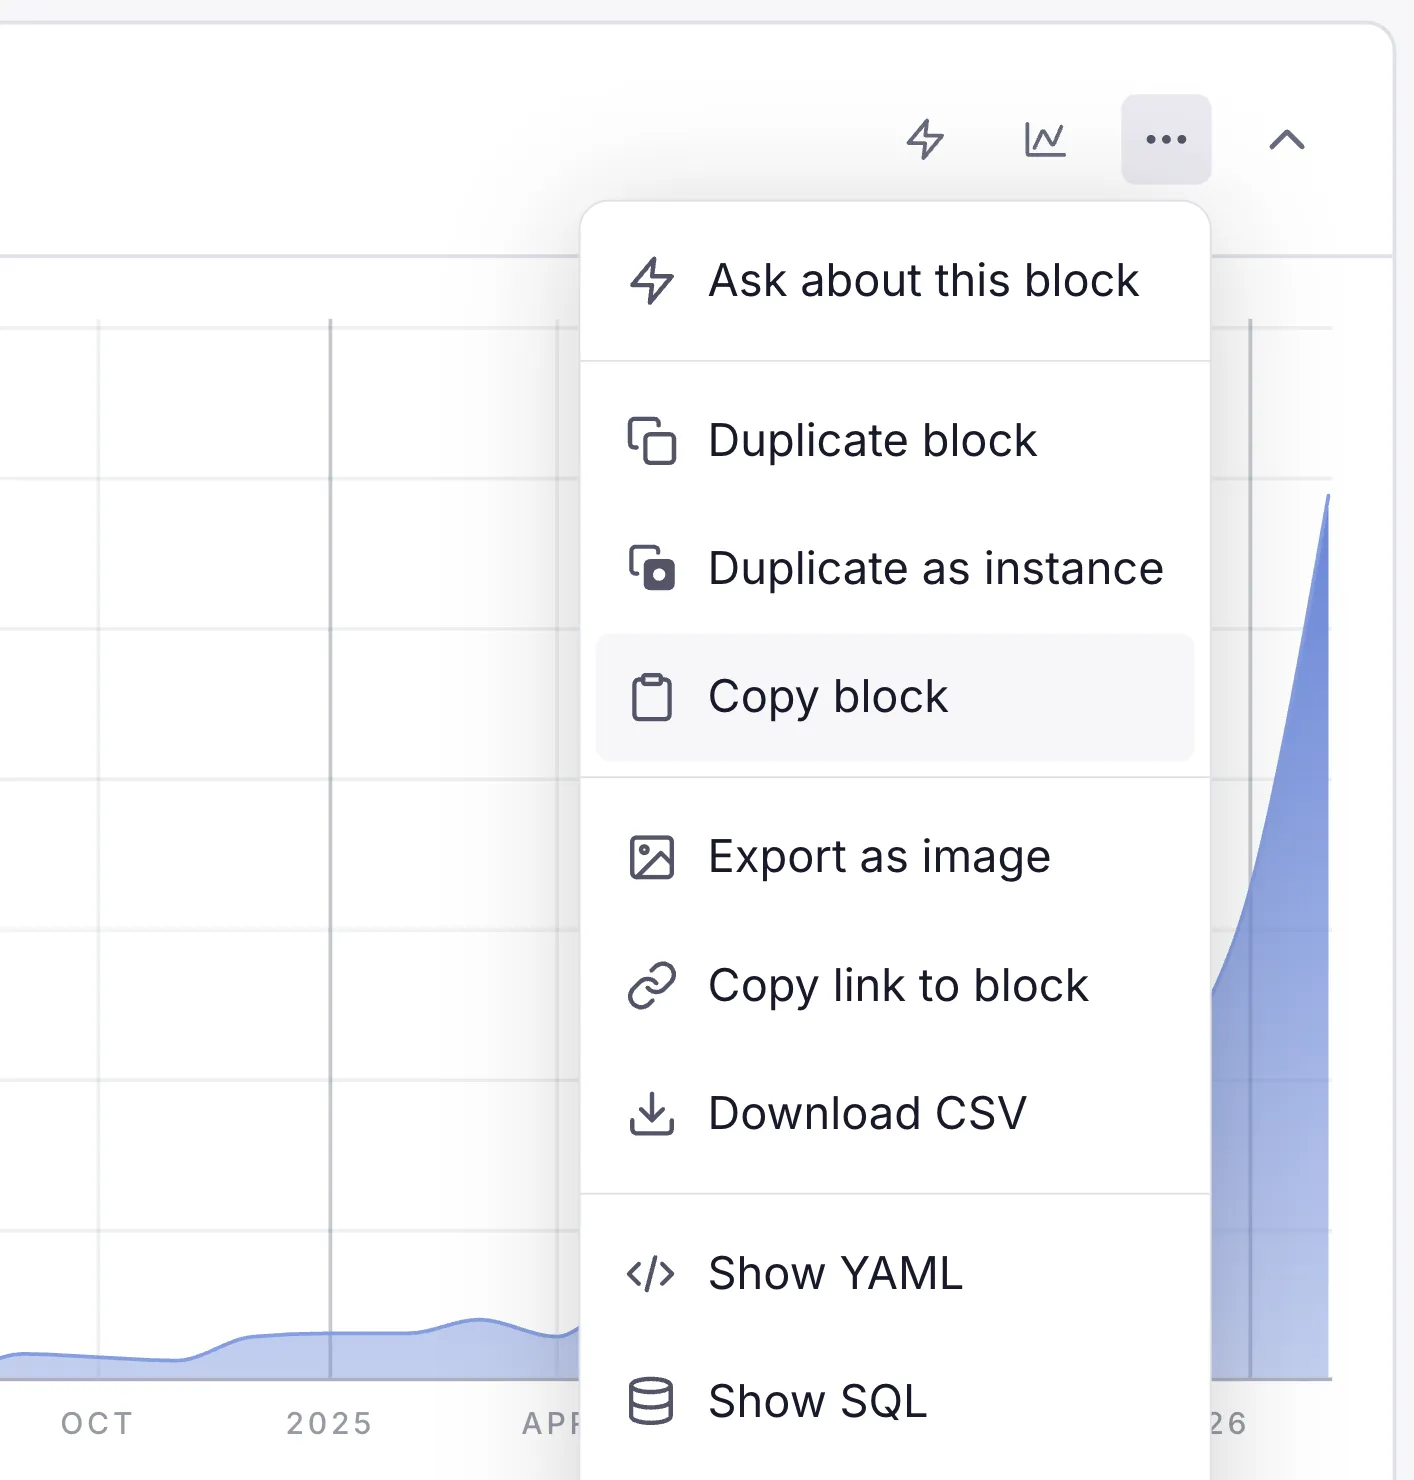
You can now export your models, metrics, and saved explorations to YAML files using Supersimple's CLI. Run supersimple export to try it out!
The import and validate commands have also been upgraded to support glob patterns and directories.
# Export models, metrics, and explorations:supersimple export -o my-config/# Export just the explorations:supersimple export --explorations -o my-config/# Import all explorations from a directory:supersimple import explorations/# Import using glob patterns:supersimple import models/user-*.yaml# See available flags:supersimple export --helpsupersimple import --help
This is particularly useful for managing large bulk changes, including refactoring your data model. You can export your current configuration, make changes in the YAML files, and then re-import everything to apply the updates. On your own, or by letting your coding agent use the CLI.
Semantic layers are great, but it's impossible for them to cover everything. One of the most useful sources for additional context is your codebase itself!
That's why we're pumped to announce Supersimple's native GitHub agent for finding definitions and gotchas from code – things that the analytics agent needs to know about.
Supersimple's GitHub integration spawns powerful coding agents to roam around your repos and pull requests. Pick the repos you'd like to include when setting up the integration, and we'll take care of everything else.
Bringing the context of your codebase into BI is a huge unlock. We can't wait to hear what you think, and all the use cases this unlocks!
AI can now reference and cite information from earlier messages in the conversation without re-searching. This makes responses faster and more context-aware.
Supersimple's AI can now choose to query data in addition to simply operating with model and exploration metadata.
This makes the agent significantly more capable of debugging data issues, cross-referencing things, and jumping back-and-forth between structured and unstructured data sources.
You have full control over which data models the AI may access. Currently available under Research mode for select accounts.
The page now automatically scrolls when you drag a block's resize handle near the edge, making it easier to resize blocks that extend beyond the viewport.