Null values as gaps in charts
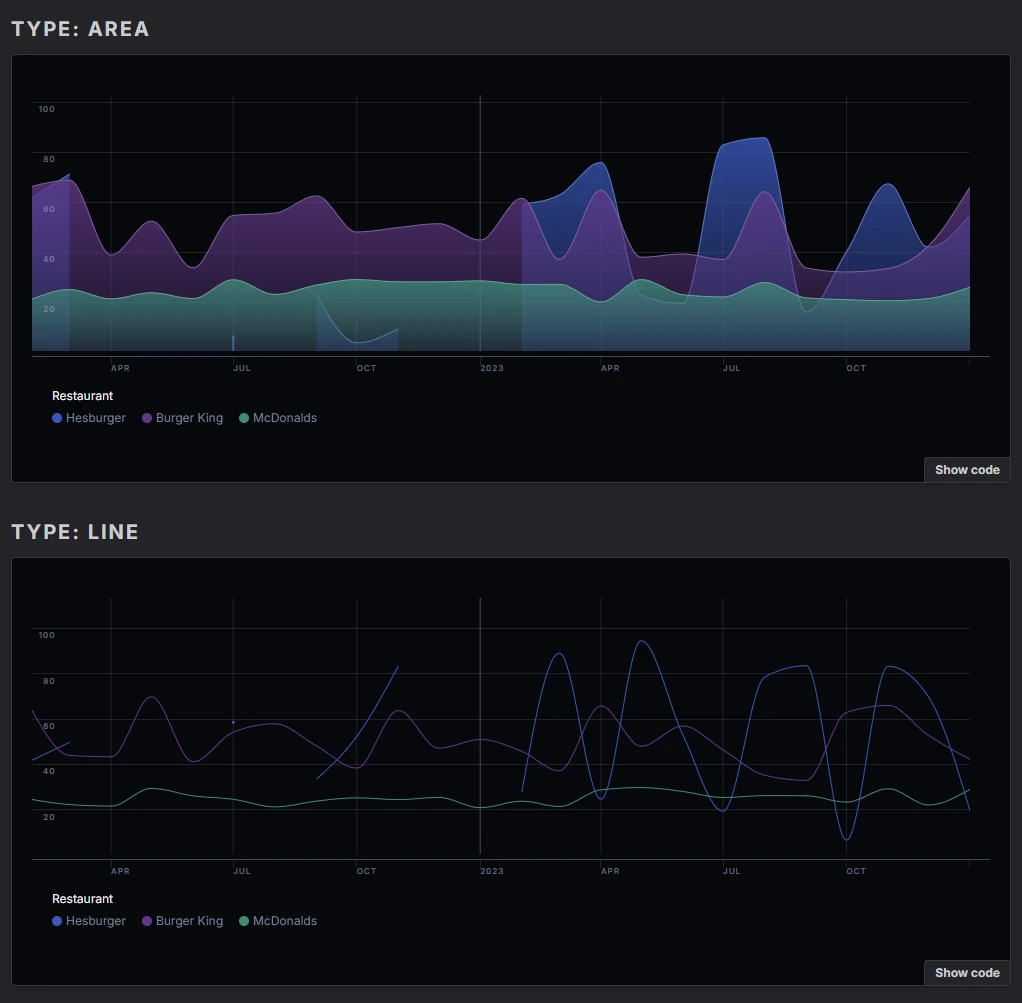
Null values in charts are now displayed as gaps instead of zeros. This should make understanding missing data a bit less confusing!
Null values in charts are now displayed as gaps instead of zeros. This should make understanding missing data a bit less confusing!
Ready to get started?