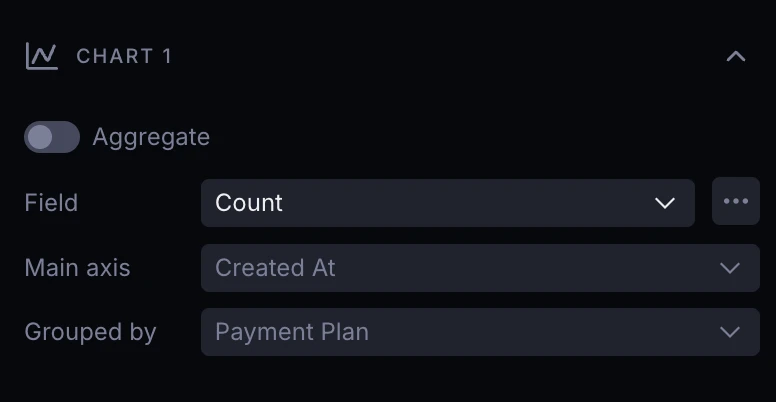
Non-aggregated charts on Summarized data
When adding a chart to a block with a Summarize step, the chart now automatically picks up the relevant axes and pre-fills everything. It just works.
New features, improvements, and fixes from the Supersimple team.
When adding a chart to a block with a Summarize step, the chart now automatically picks up the relevant axes and pre-fills everything. It just works.
in custom formula functionFormulas now support the 'is one of' operator using the in() function syntax: in(value, option1, option2, ...). See docs for more!
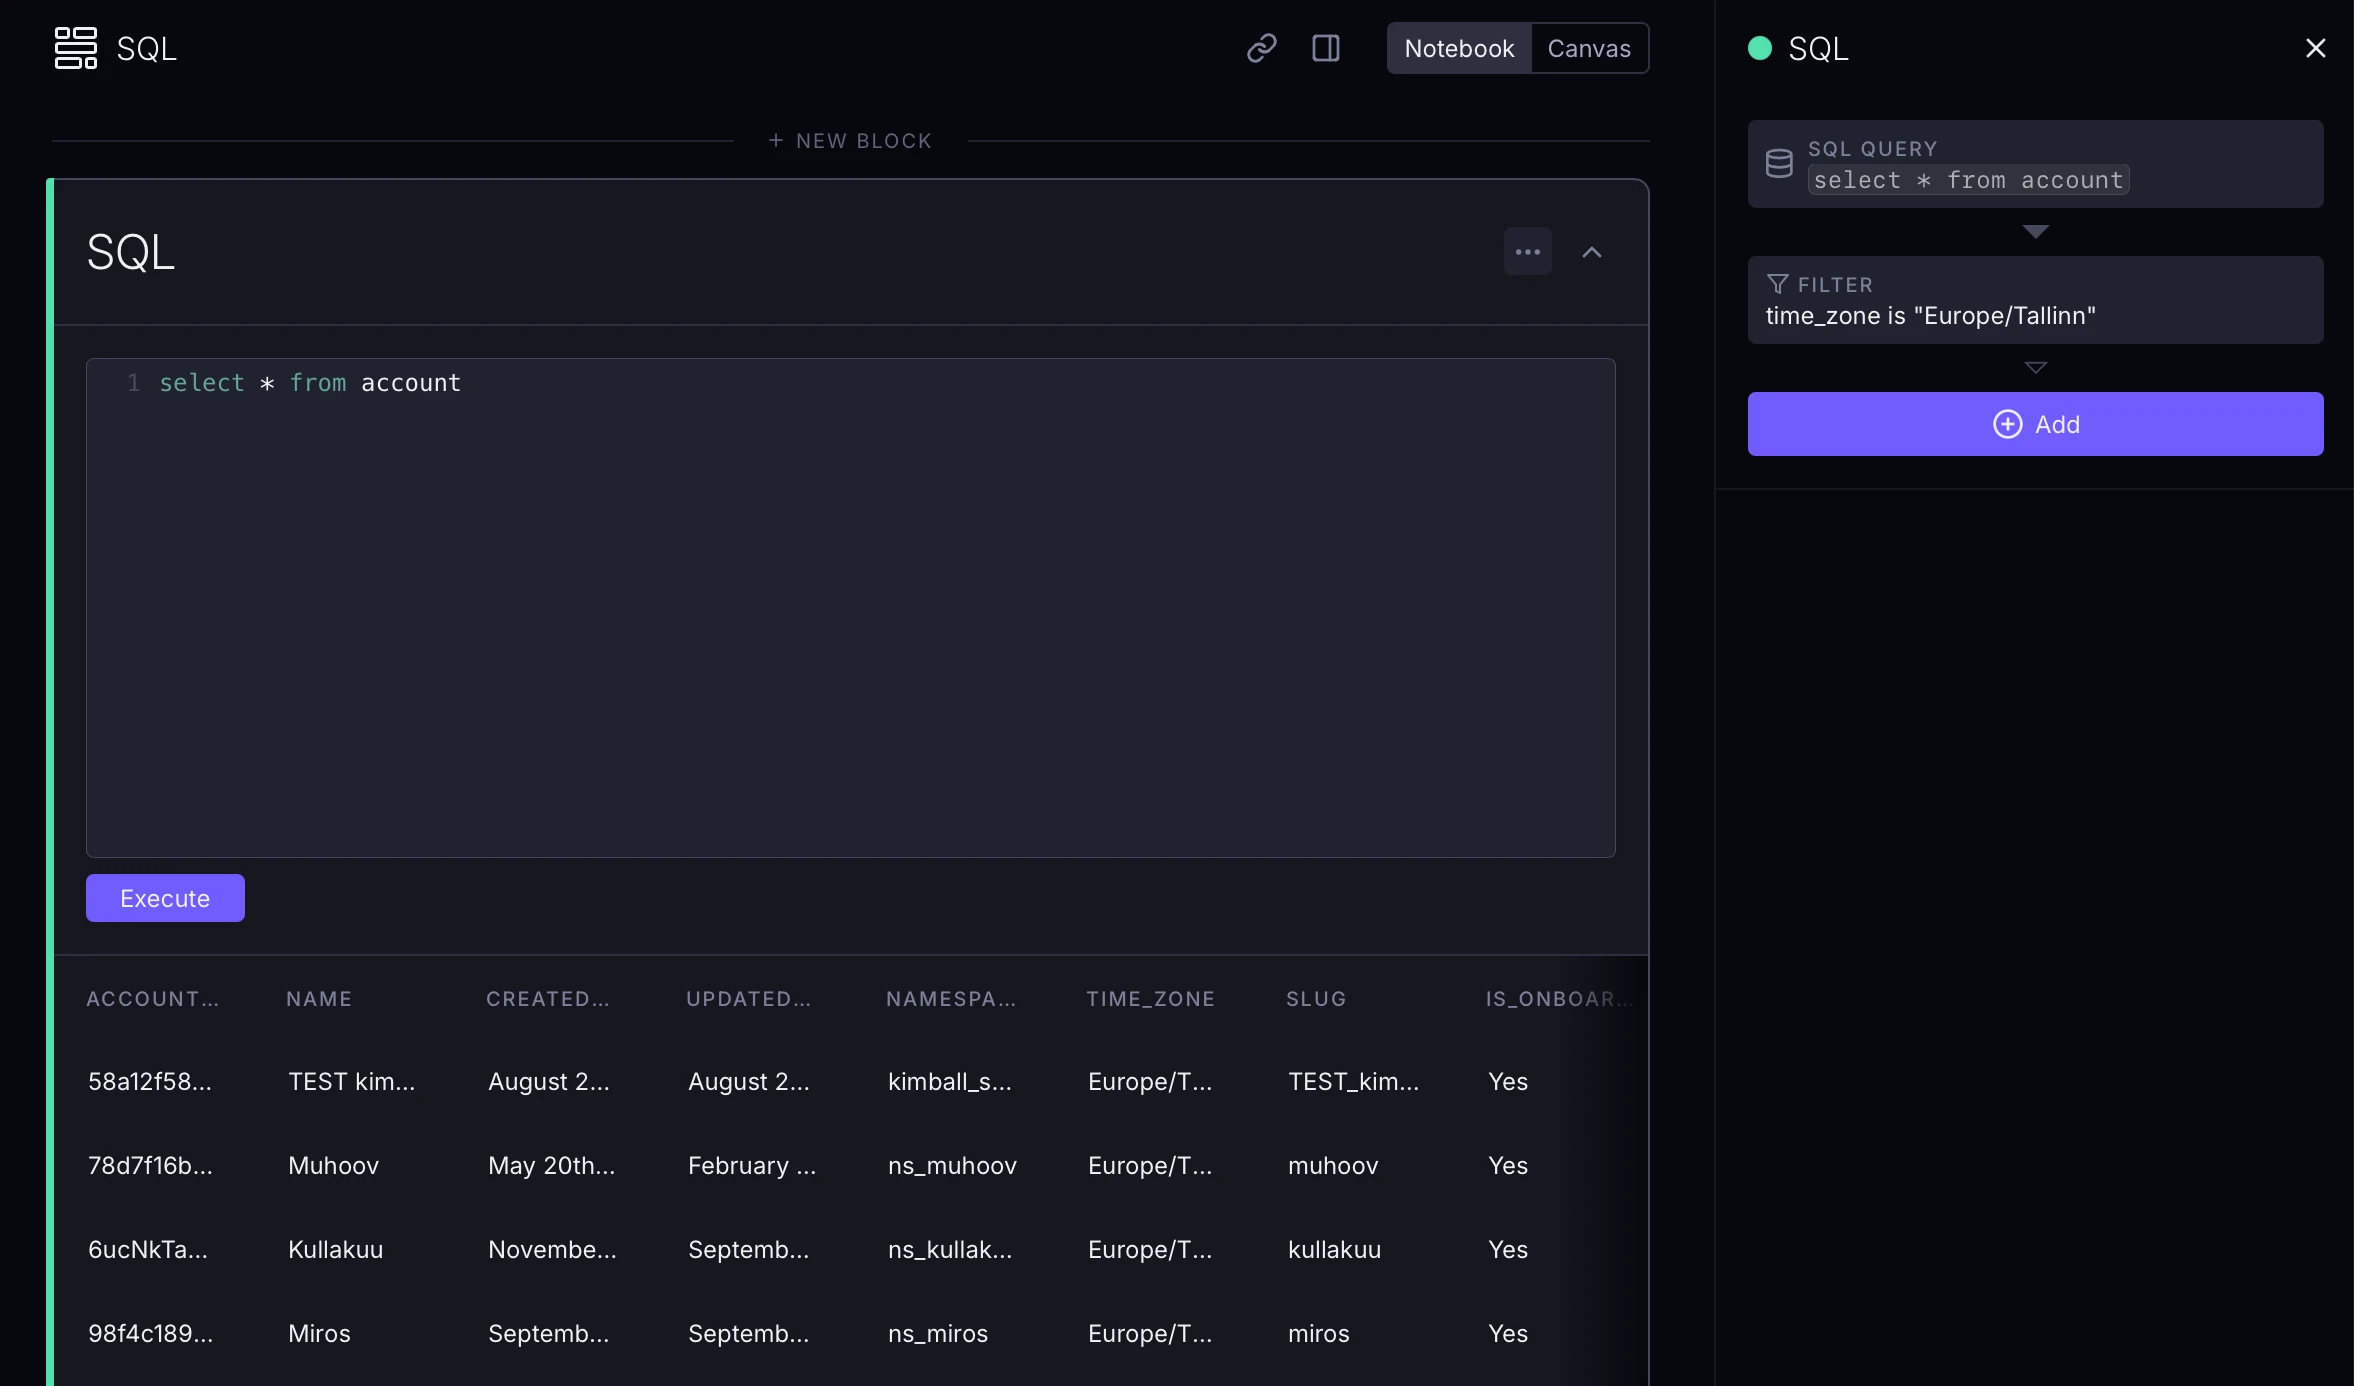
You can now apply any no-code steps to SQL blocks. Go back and forth between code and no-code – use what makes sense.
range_min and range_max window functions (see formula docs).You can now reorder select variable options by dragging them around.
The 'is one of' and 'is not one of' filters now use a pill-style interface that's easier and more intuitive to use.
You can now filter data using a comma-separated list of values for more flexible filtering options.
Model definitions and SQL blocks now support a {{user_email}} placeholder in SQL. This lets you implement row-level security and user-specific filtering. See row-level security for more!
Model sections in the sidebar can now be collapsed and expanded for better organization and navigation.
Sidebars are now resizable by dragging, and you can double-click to reset them to their default width.
Hover over table headers to see model property descriptions.
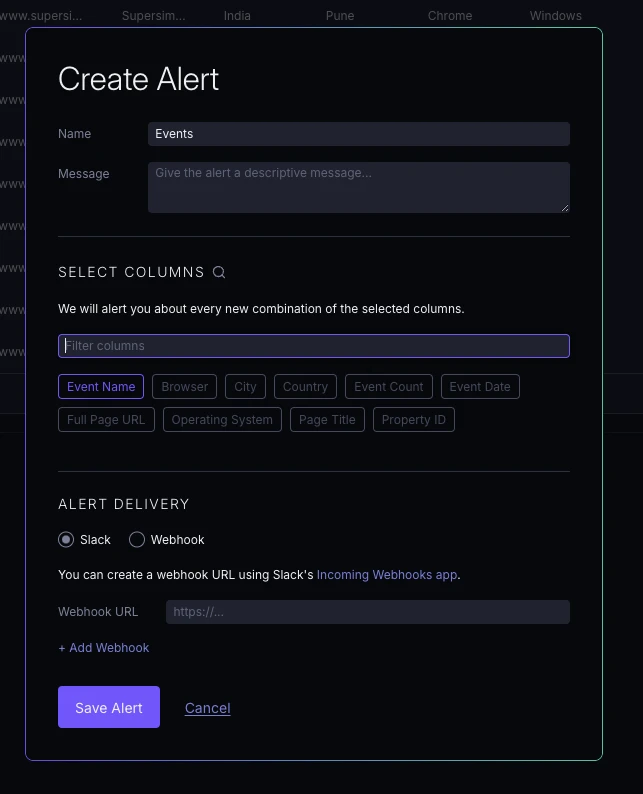
Long field lists now include a search input to help you quickly find the fields you need, available in alerts and 'Add column' flows.
You can now export records cell results to CSV format, with a default limit of 10,000 rows.
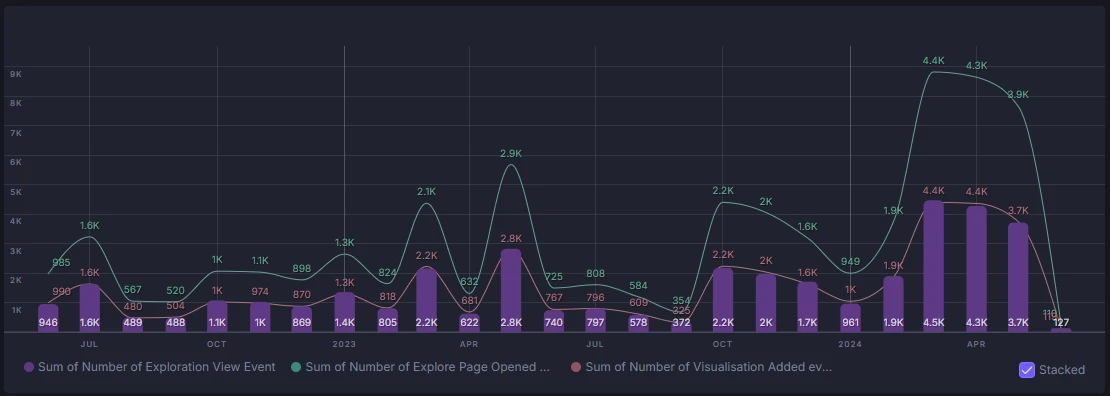
Bar value labels on time series charts are now more legible and consistently positioned at the bottom of bars.
Snowflake ❄️data warehouse support just landed.
Quarter functions in custom formulasThe new quarter() function to extract quarters from dates and extract(interval, 'quarter') to get quarter counts from intervals.
Primary keys and relation keys are now displayed without formatting for clearer data viewing.

New 'raw' format displays values without formatting. You can also use 'default' in a formula format() function to reset to default formatting.
You can now copy blocks via the (...) dropdown and paste them into other explorations. Or even elsewhere in the same exploration. Or even a different account. Go crazy!
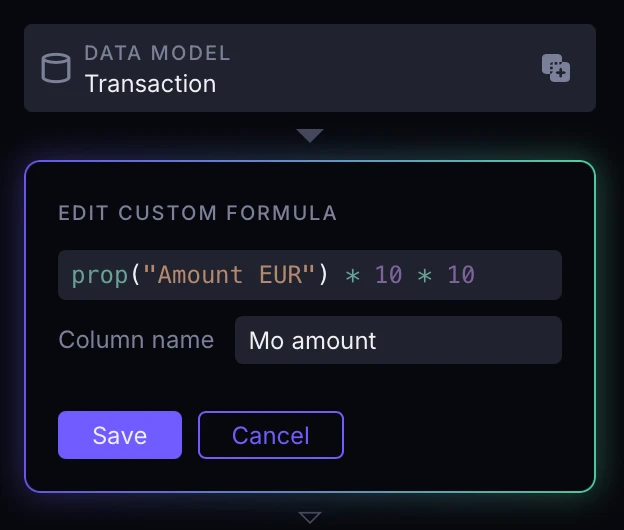
Custom formulas now supports standard operators including +, -, *, /, ==, !=, <, <=, >, >=, &&, and || for more intuitive formulas (deprecating add(), gte() etc).
Click on horizontal bar chart category labels to quickly add filters.
Click on the "Data model" step of a block to replace the source with a different model or even an instance of another block in the same exploration.
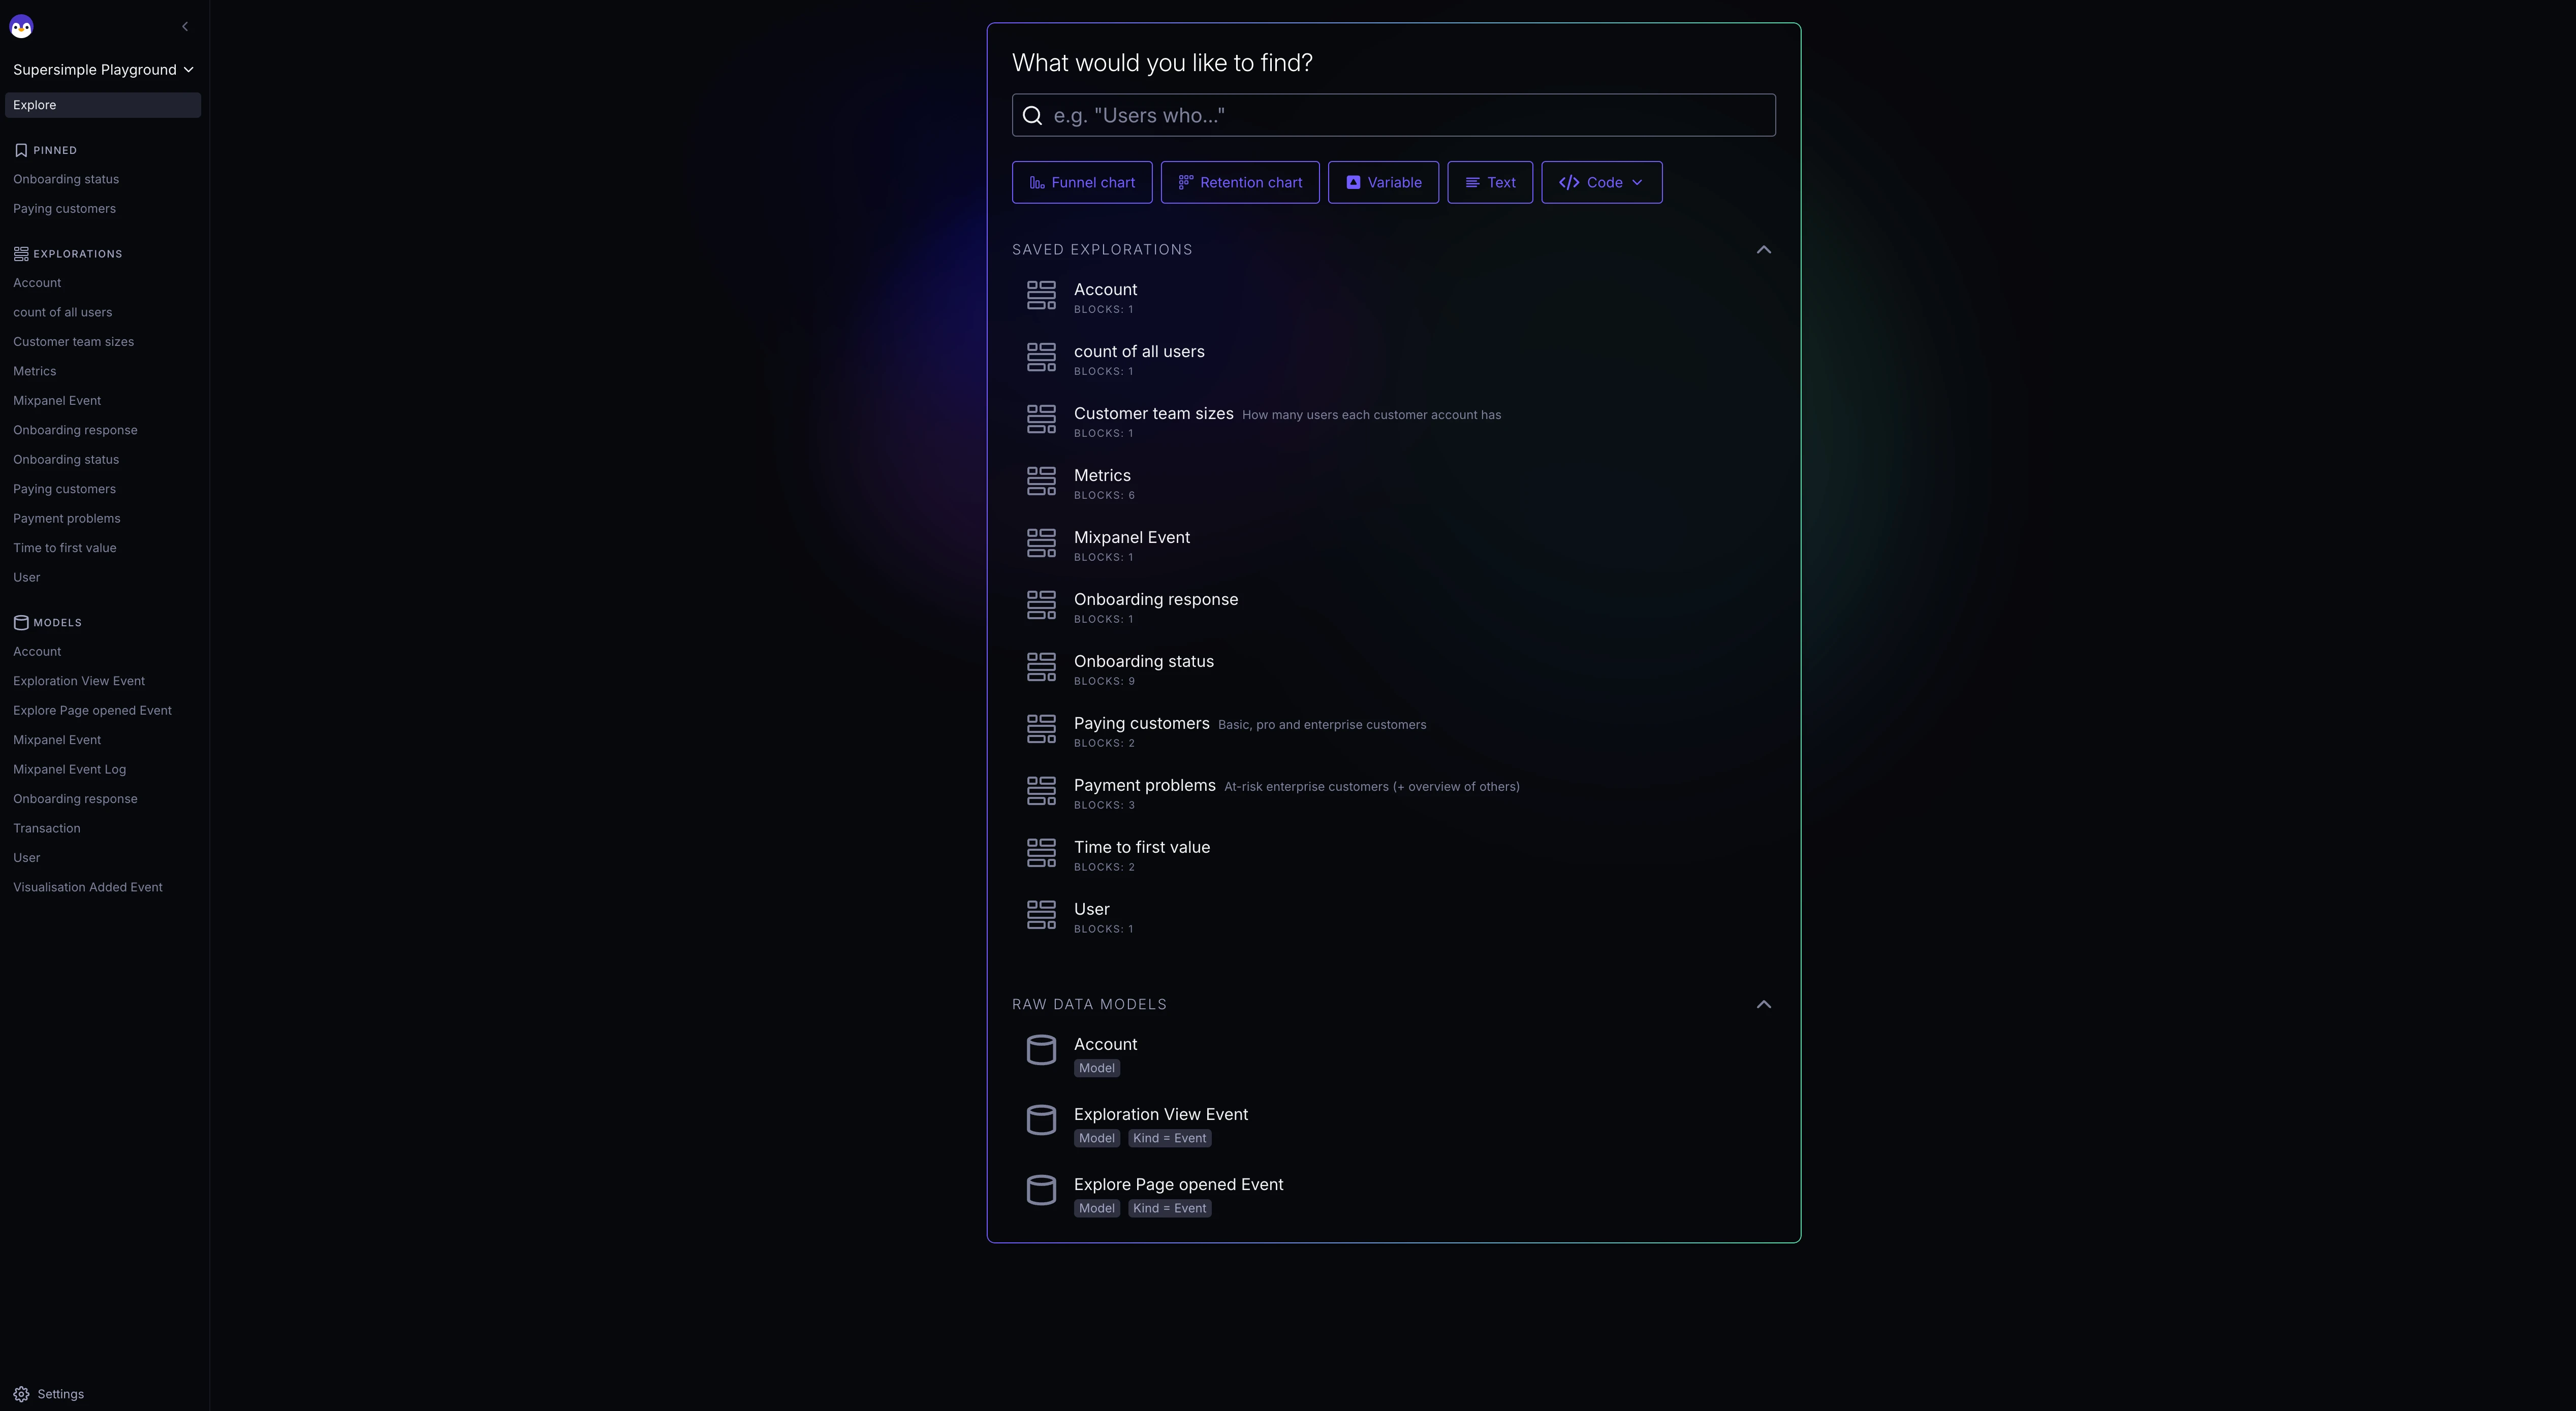
The sidebar has been redesigned with a new, more compact layout.
You can now view the underlying YAML structure for records, funnel, and retention/cohort blocks. See operations in docs for how to use this!
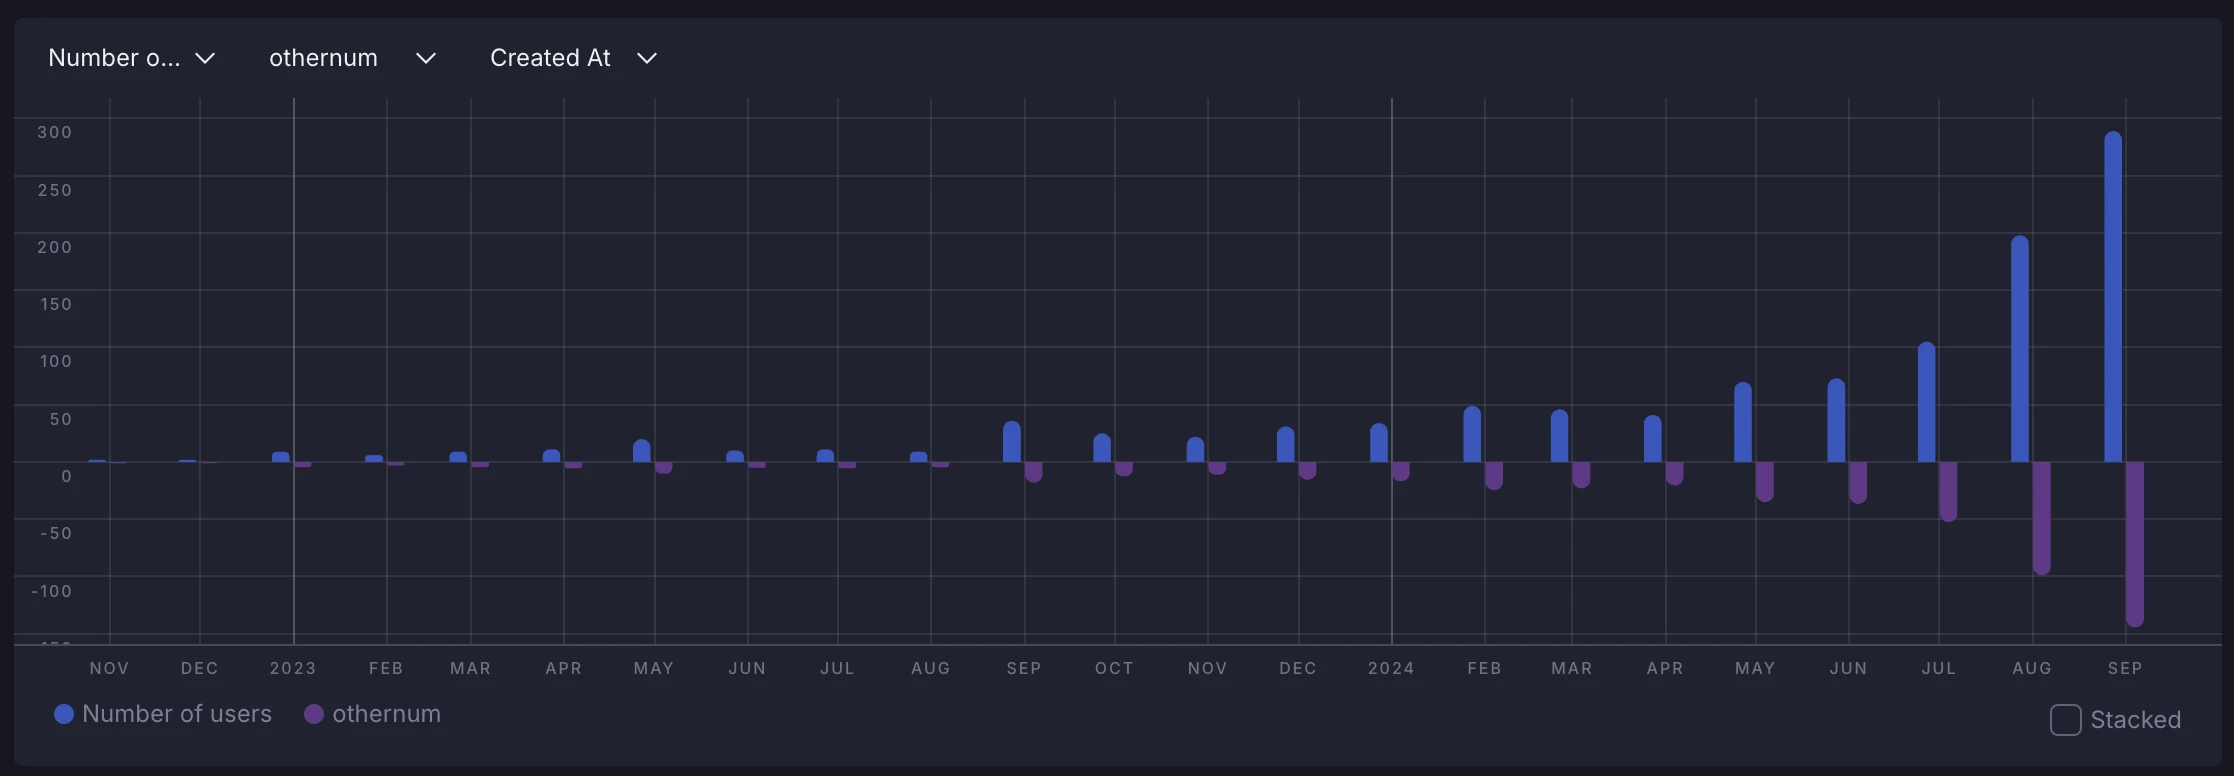
Bar charts can now handle negative series! Those not working great used to be a negative thing. It's now a positive. Because they work.
Charts now inherit number formatting that you've configured elsewhere: be that currencies, percentages, or anything else.
You can now define number, currency, and date formats for model properties directly in your YAML configuration files.
Escape to deselect blocksPress the Escape key to quickly deselect and close the edit view for any block, or context menu, dropdown, or modal.
Click inside any time series chart and hit "Filter by" to quick-create the appropriate filter to dig deeper.
You can now change the color of individual chart series.
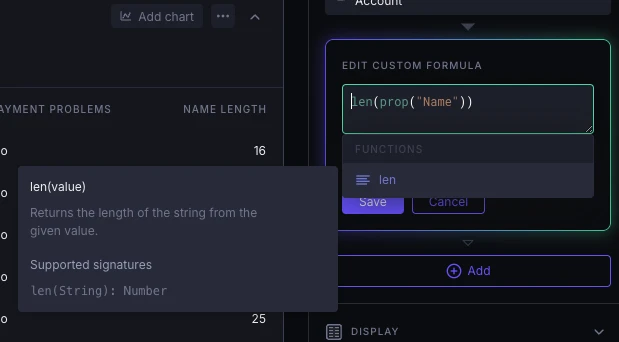
len() custom formula functionA new len() function is now available in custom formulas for measuring the lengths of text-like fields.