Hide columns directly from dropdown menus
You can now hide columns directly from the table header dropdown menu.
New features, improvements, and fixes from the Supersimple team.
You can now hide columns directly from the table header dropdown menu.
Supersimple has been mobile-friendly since day 1. Nevertheless, we shipped a big bag of various improvements to make navigating explorations and changing steps on mobile a smoother experience.
You can now drag and drop to reorder columns in tables. The order persists when you save or share the exploration.
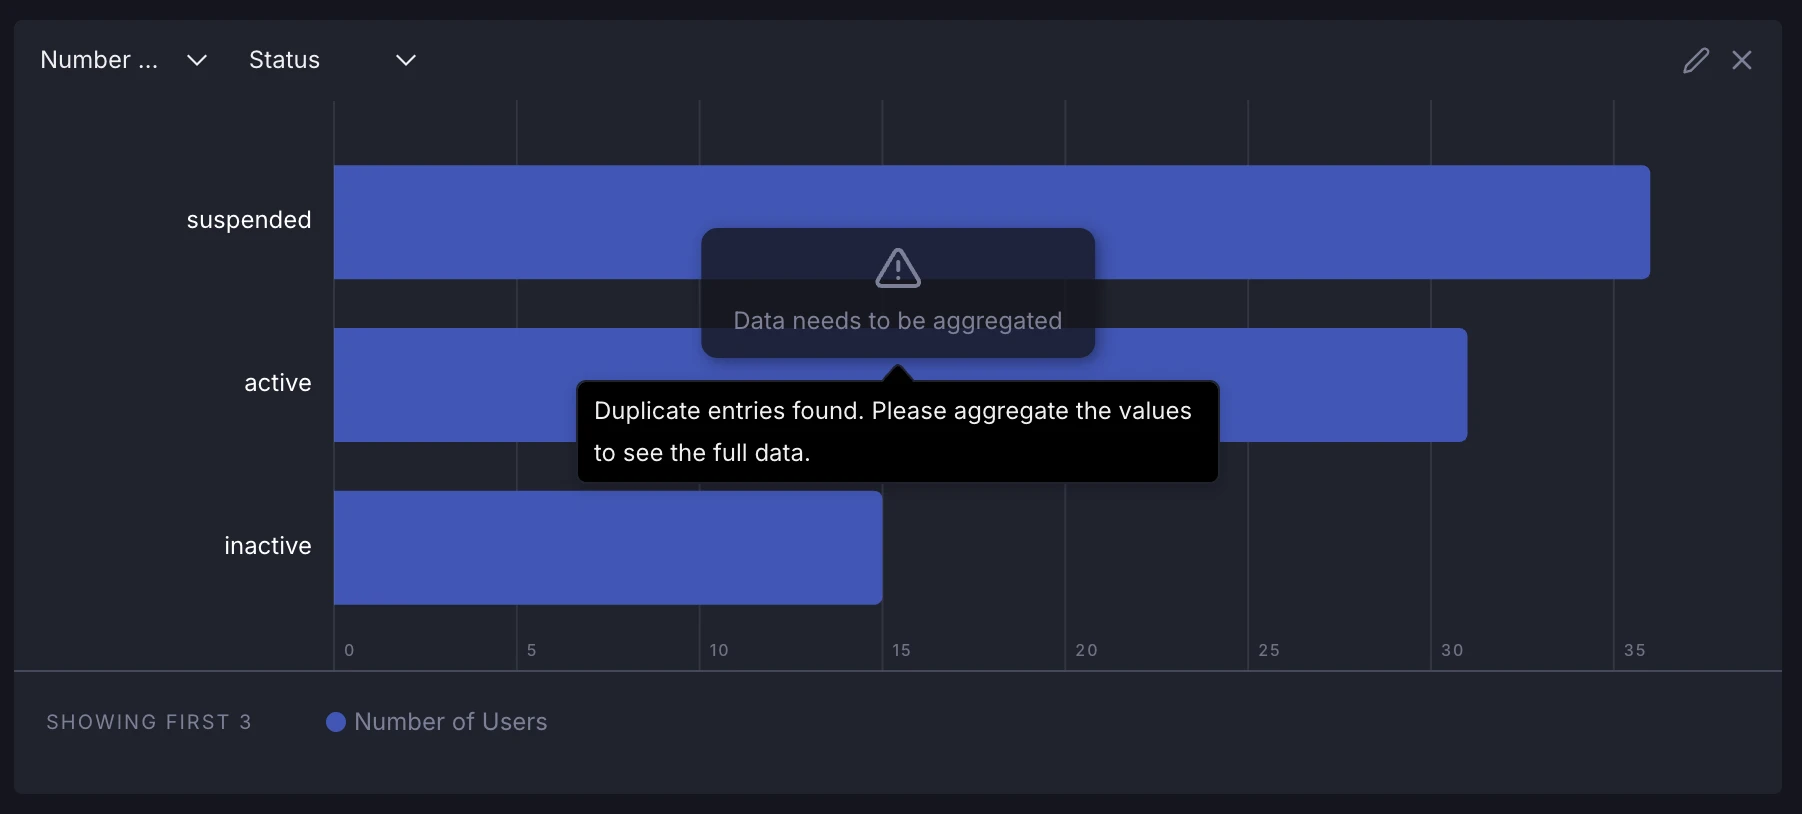
Non-aggregated charts now detect duplicate values where none are expected. In this case, we now show a non-dismissable warning, as this can lead to non-obviously incorrect results.
As the Settings page had grown over the years, it was in dire need of reorganization. It's now split into subpages for General settings, Alerts, Integrations, AI, and Developer options.
In one of those newly-created tabs, Integrations, you can now setup our native Google Drive and Notion integrations without ever talking to support.
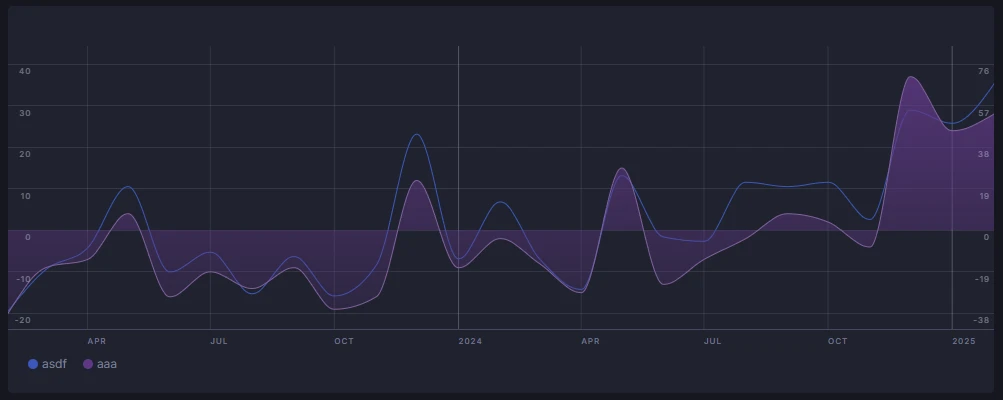
Horizontal bar charts now support a secondary axis, and axis labels have been repositioned inside the chart area for better symmetry.
Filtering with "is one of" or "is not one of" on enum fields now uses a more intuitive, searchable multi-select input.
Added support for Amazon Redshift data warehouses.
Google Drive integrations now support incremental sync of shared folders, meaning updates reach Supersimple even faster.
Google Drive now syncs incrementally, updating only changed files instead of re-syncing everything for faster and more efficient updates.
Search agent now automatically detects and fixes issues with citations, hallucinated content, and malformed responses to improve reliability.
Supersimple's AI can now work across significantly longer time horizons. You can even close the tab & come back to it later, without losing any progress.
Previously limited to a select few, our most advanced analysis agent is now available to all customers!
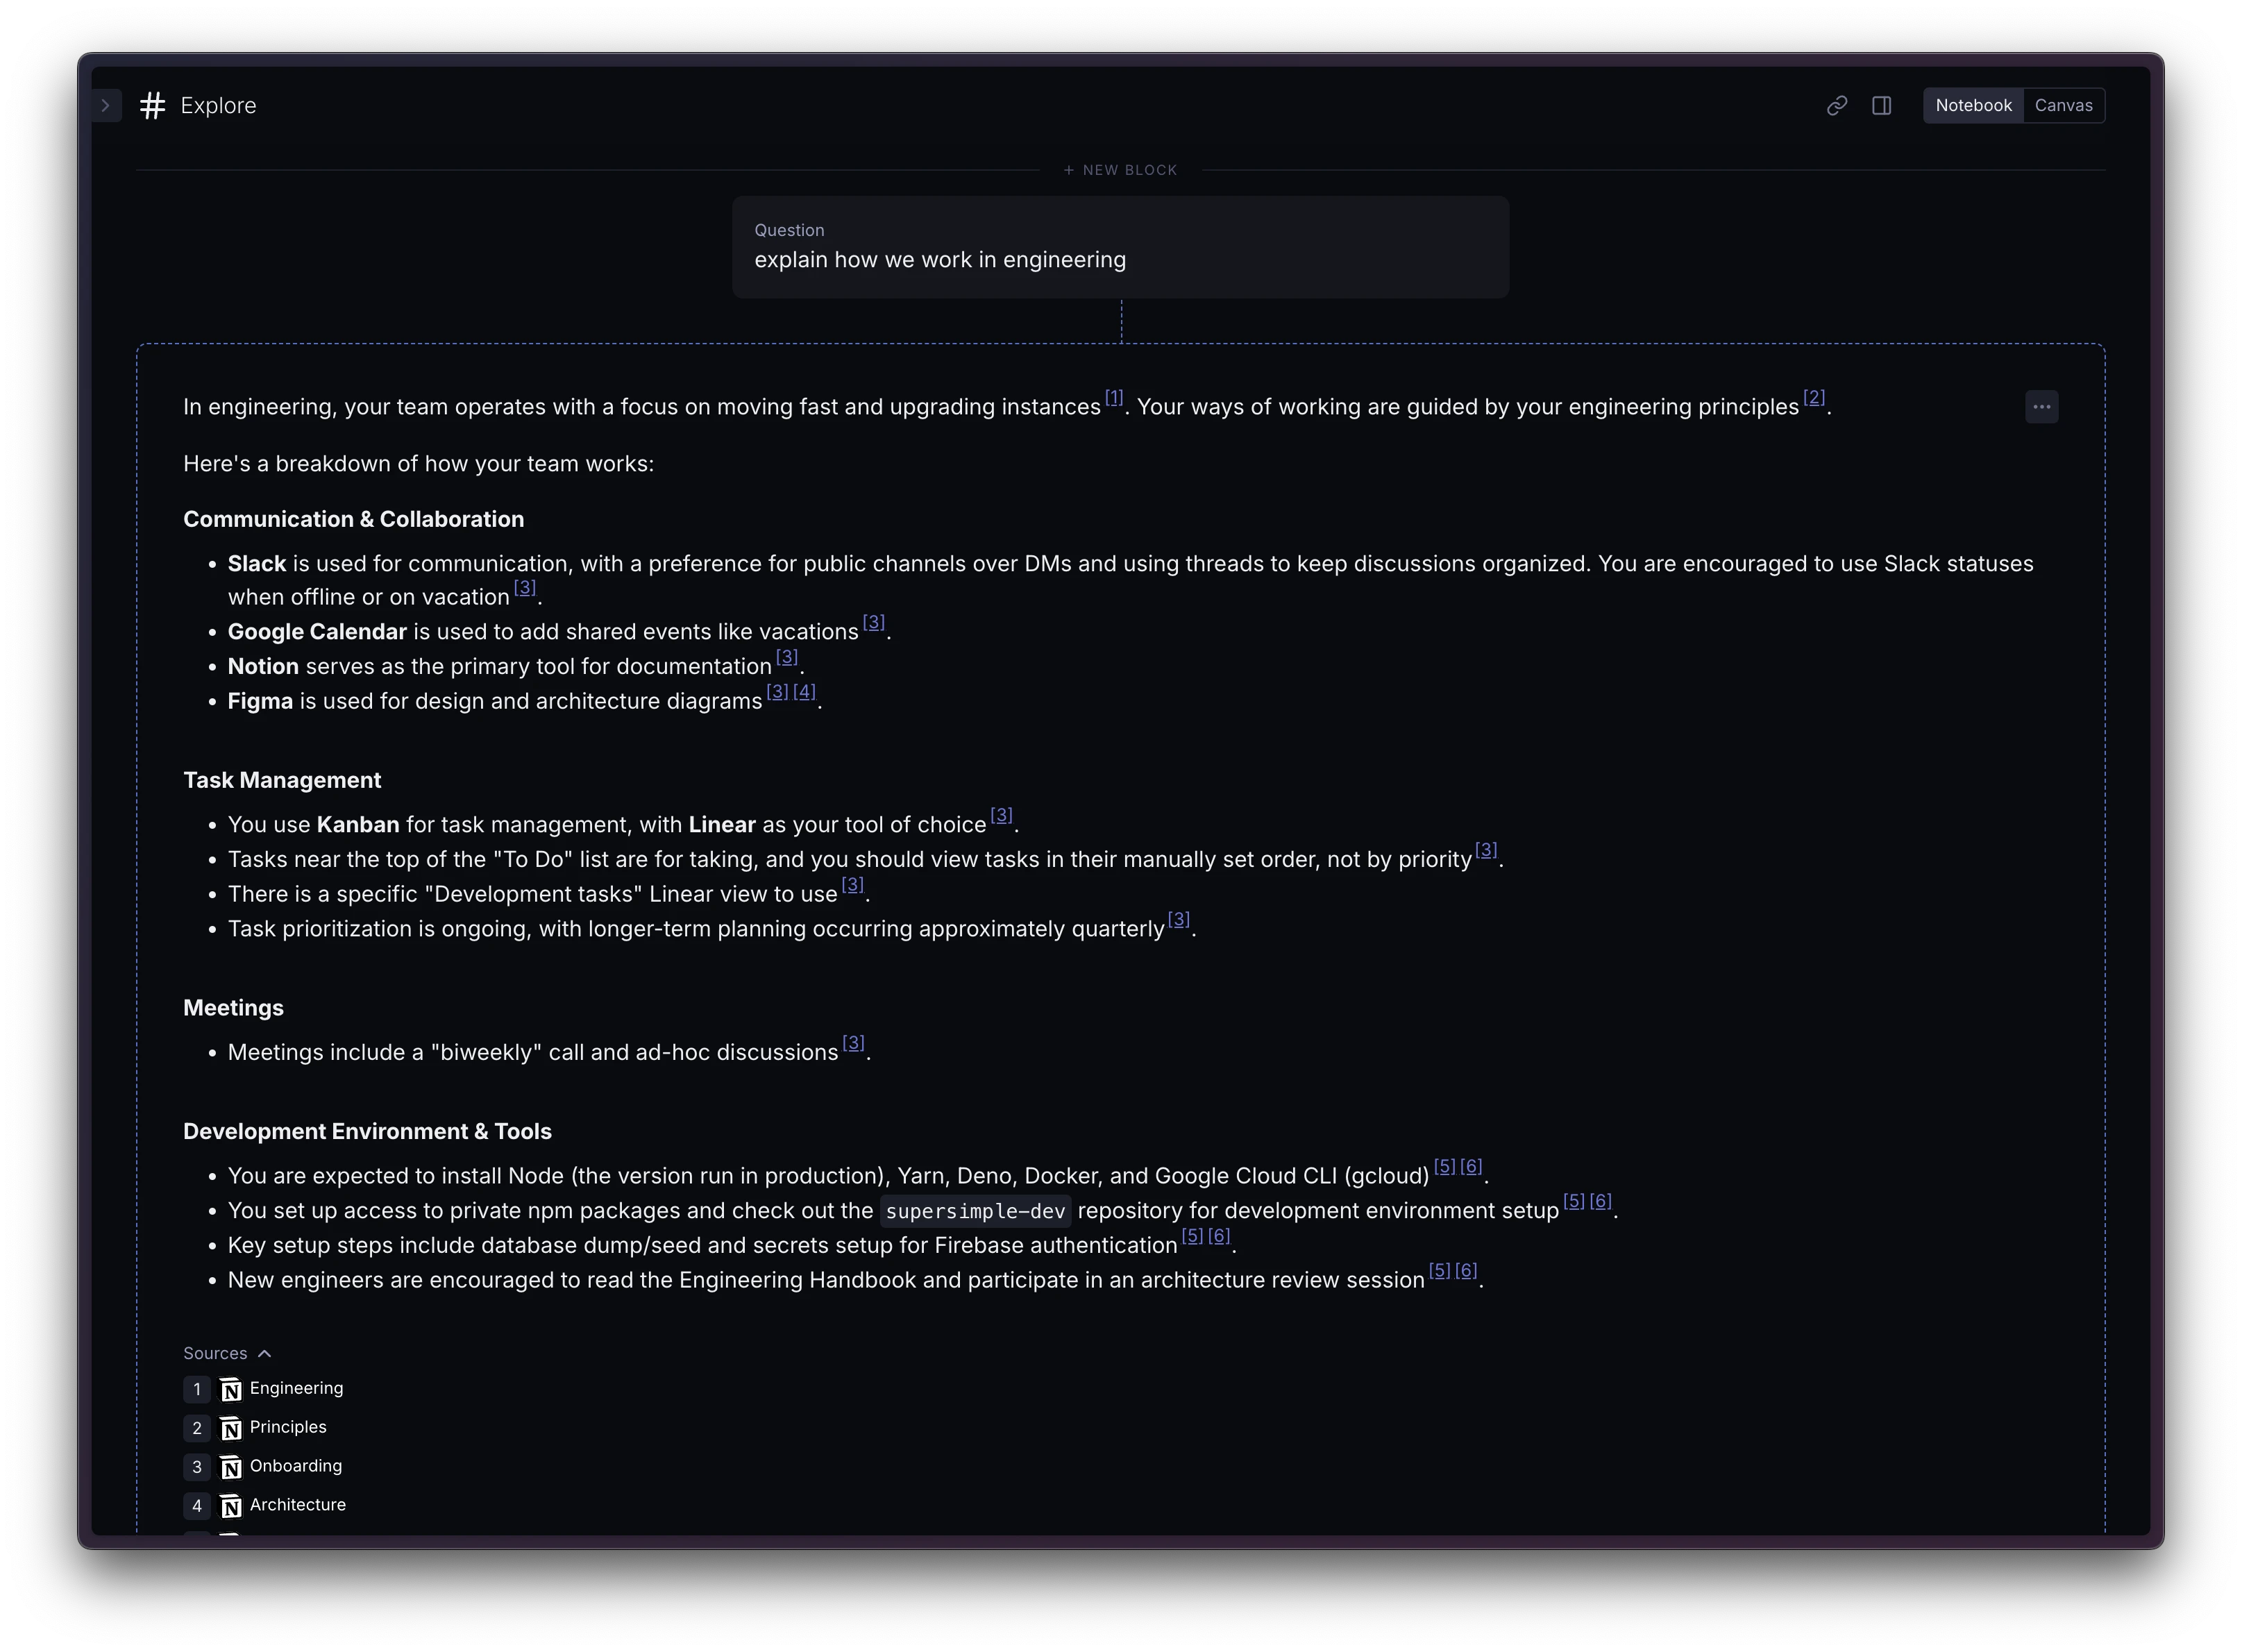
The agent is able to combine data across multiple data sources – for example, finding unstructured context about your data models from internal docs or Slack, and using this information to put together correct database queries later.
You can now filter on related fields through hasOne and hasOneThrough relations in New Column filters, without first "bringing in" that data into your table.
Chart labels are now significantly smarter at avoiding overlap with nearby labels – nudigng themselves around when needed.
Charts with Big Numbers now support period-to-date comparisons, as well as a cleaner overall comparison setup UI.
For example, you can now, in one click, compare this month's sales to the same time last month. Alright, if you haven't opened the comparison options yet, it might take you one extra click.
Links in your questions and messages now appear as clickable chips for easier interaction.
You can now import and search within ASICE (digitally signed) files across your connected unstructured data sources.
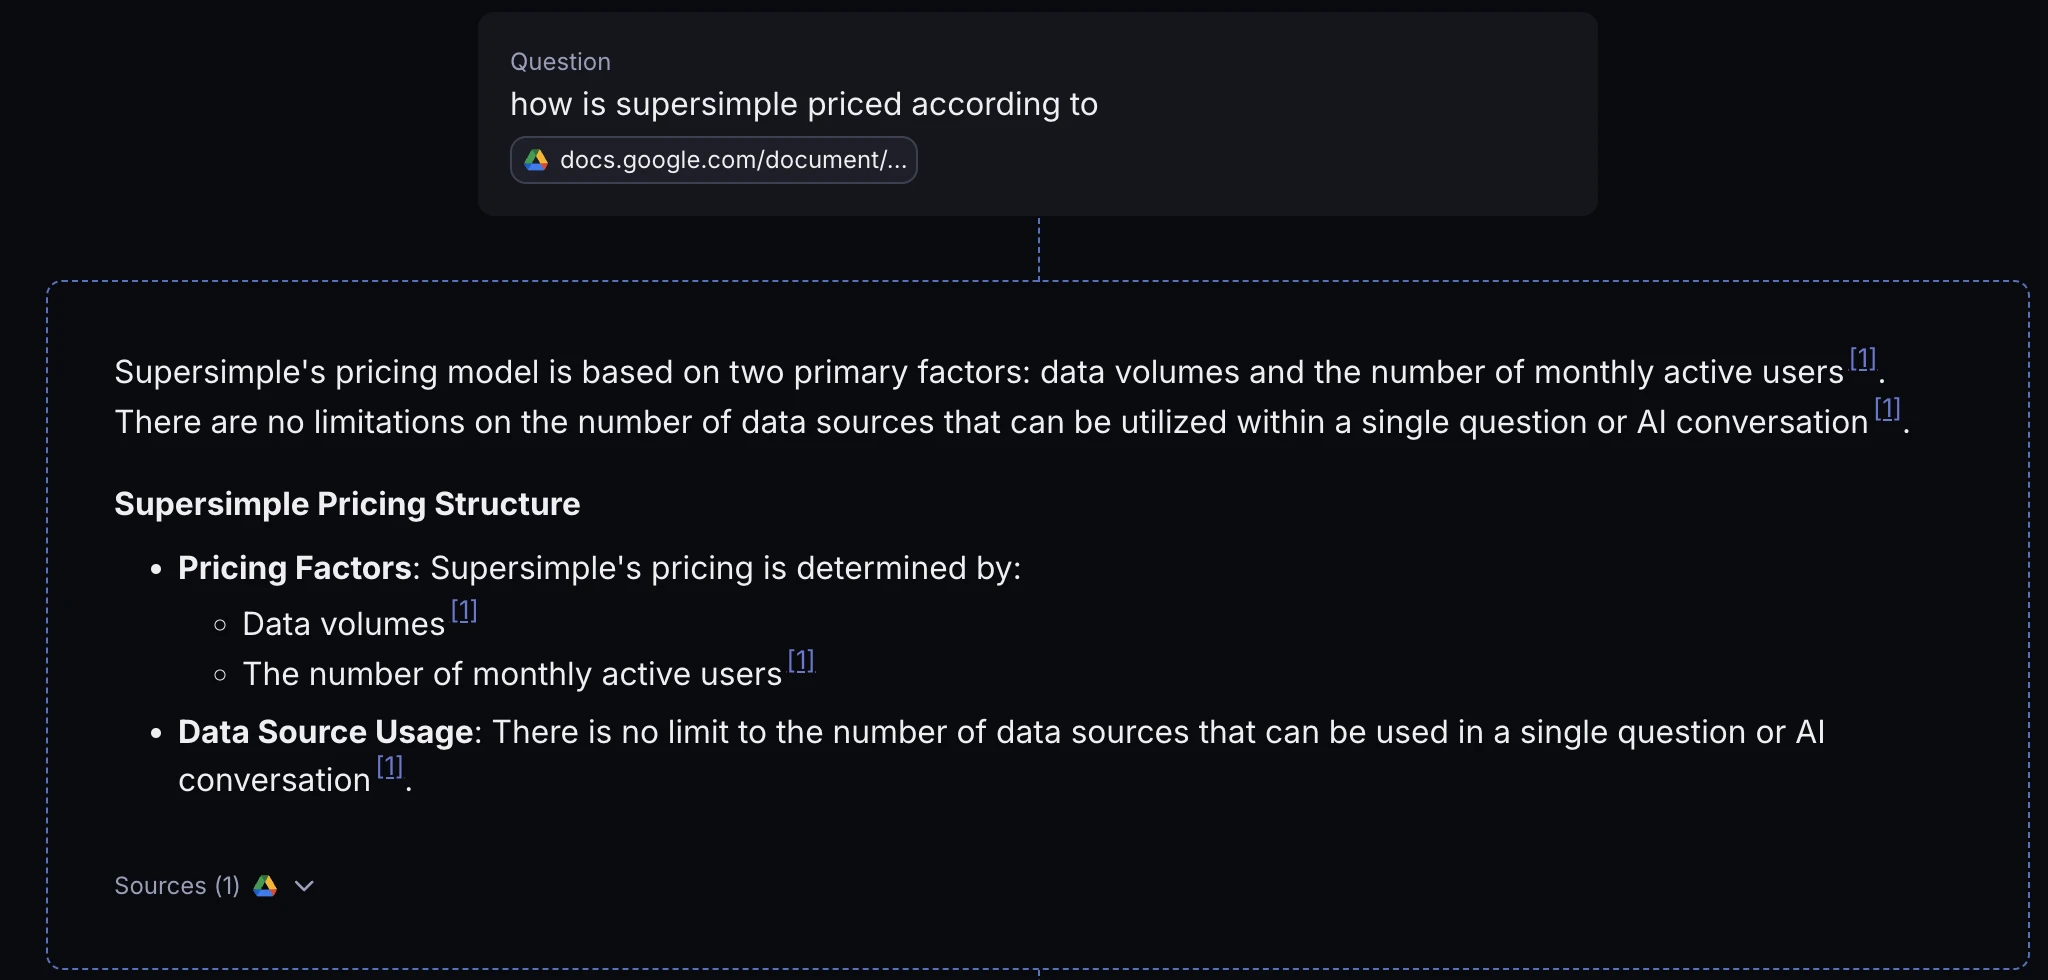
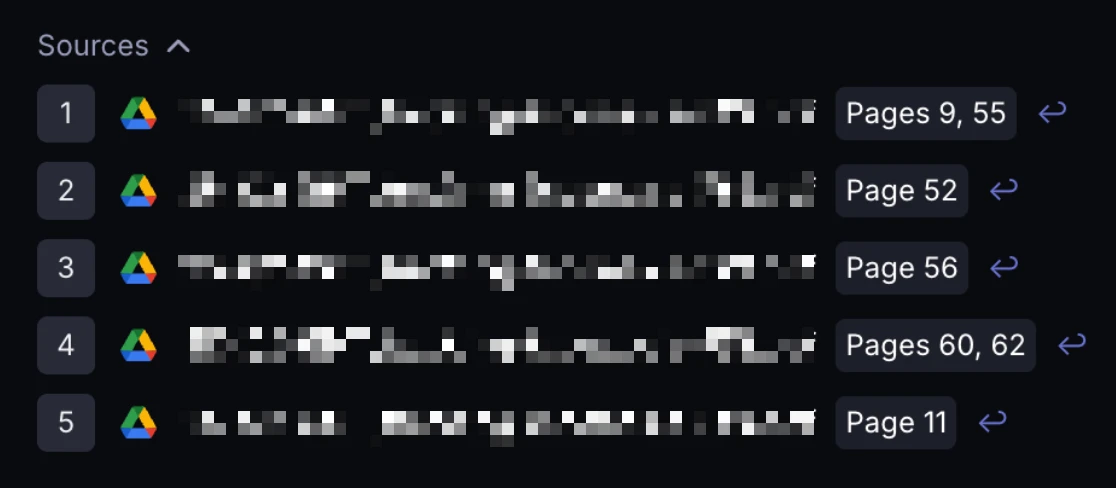
In addition to referencing sources like Notion pages in footnotes, AI now draws your attention to the most relevant documents in a bigger callout.
In Canvas view, blocks now snap to each other, both when resizing as well as moving them. May your canvas look tidy!
You can now Combine more than 2 blocks together at once. Any number, really. Please combine responsibly.
Keyboard lovers can now quickly access AI settings by pressing the Down arrow key while in the text input.
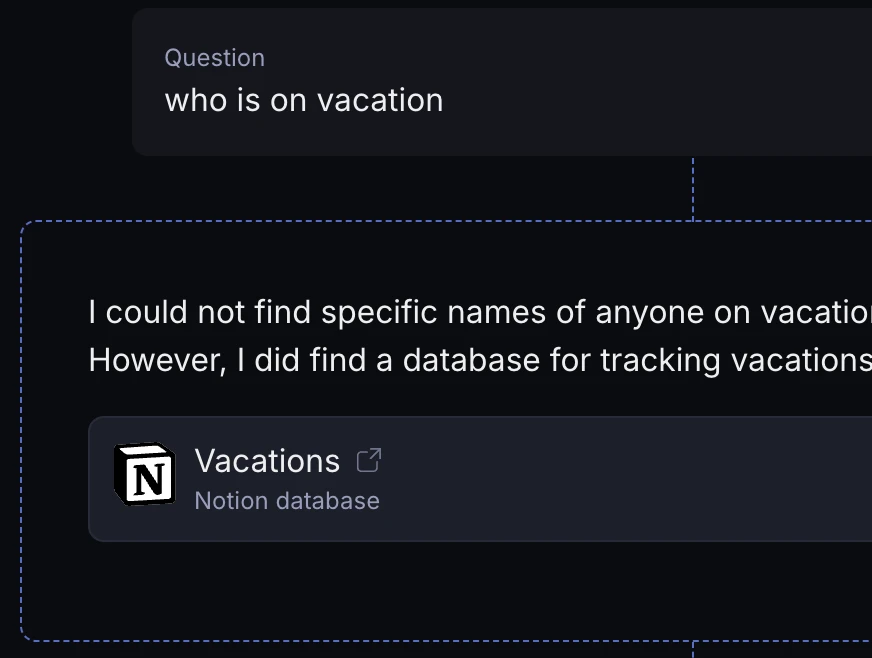
Supersimple's enterprise search now supports Notion as our latest native connector. Pages and databases are kept up-to-date in custom search index.
Supersimple's AI has gained valuable new skills, too – namely, navigating Notion databases, parent pages, sorting, filtering, and more.
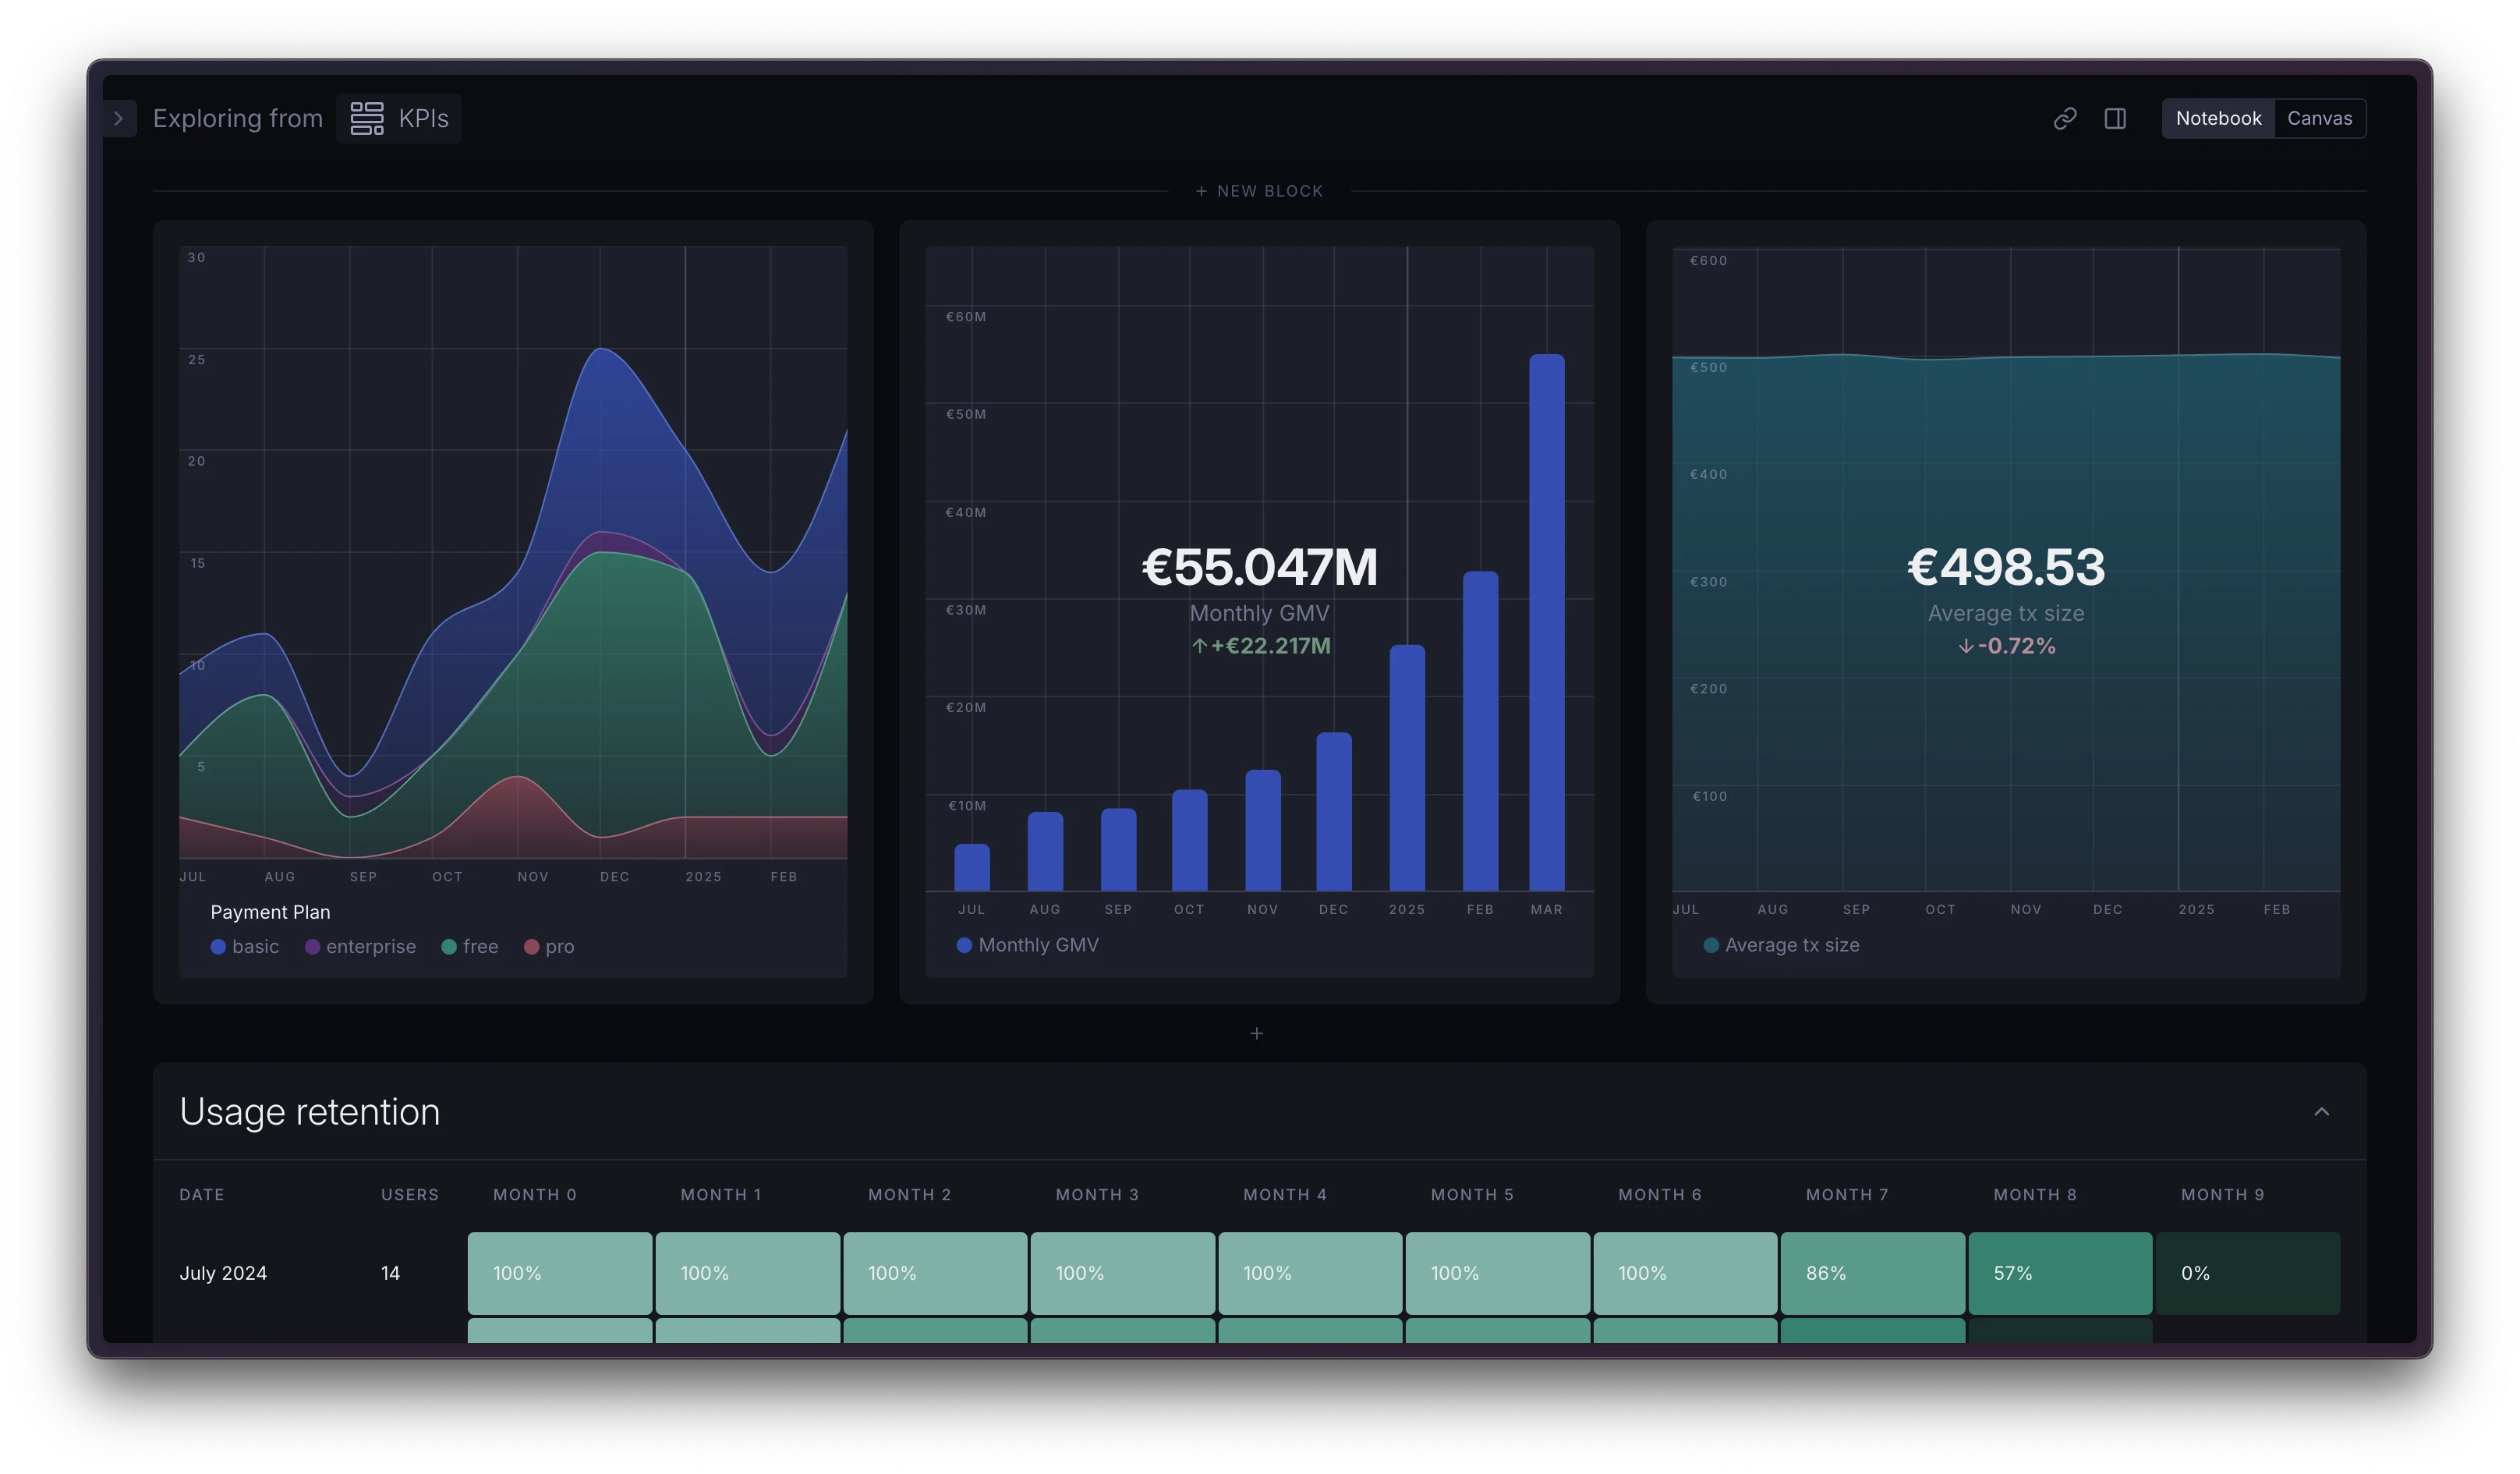
Your Supersimple dashboards can now look more compact:
The 'Reload data' action on a block now also refreshes any associated charts, not just table data.
Chart axes now show whole numbers without decimal places when displaying integer values, with tick marks aligned precisely.
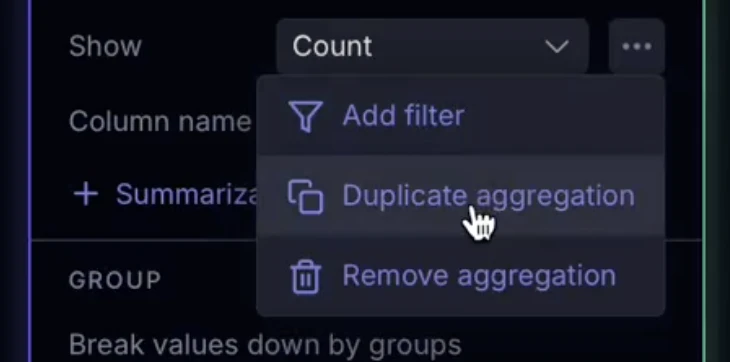
You can now duplicate aggregations to speed up creating similar calculations.
When AI references PDF documents, footnotes now include specific page numbers where the information was found.
Field dropdowns now show each field's type, description and origin data model.
Relation dropdowns show the origin data model and join logic.
You can now drag and drop to reorder chart series that use different visualization types.